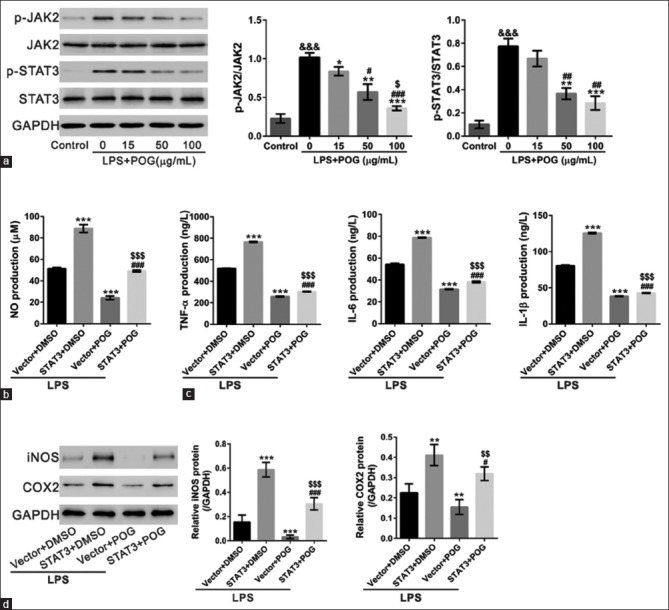
Figure 5.

Involvement of JAK2/STAT3 signaling. (a) RAW 264.7 cells were treated with lipopolysaccharide (1 μg/mL) and various concentrations of prim-O-glucosylcimifugin (15, 50 and 100 μg/mL) and harvest at 4 h posttreatment. Cells treated with dimethyl sulfoxide were set as control. p-JAK2, JAK2, p-STAT3, and STAT3 were detected by Western blotting. Representative Western blots (left panel) and quantitative results (right panel) were shown. All values are means ± standard deviation (n = 3). &&&P < 0.001 versus control; *P < 0.05, **P < 0.01, and ***P < 0.001 versus lipopolysaccharide-treated cells; #P < 0.05 and ##P < 0.01 versus lipopolysaccharide and 15 μg/mL prim-O-glucosylcimifugin-treated cells;$P < 0.05 versus lipopolysaccharide and 50 μg/mL prim-O-glucosylcimifugin-treated cells. (b-d) RAW 264.7 cells were infected with STAT3 expression lentivirus or control vector lentivirus (Vector). After 24 h, cells were treated with lipopolysaccharide (1 μg/mL), and dimethyl sulfoxide or 100 μg/mL prim-O-glucosylcimifugin. The amount of nitrite (b) and cytokines (c) in the medium was monitored at 24 h after exposure. Protein expression of inducible nitric oxide synthase and cyclooxygenase 2 (d) in RAW 264.7 cells was detected by Western blotting. **P < 0.01 and ***P < 0.001 versus Vector + lipopolysaccharide; #P < 0.05 and ###P < 0.001 versus STAT3 + lipopolysaccharide;$P < 0.05,$$P < 0.01, and $$$P < 0.001 versus POS + lipopolysaccharide
