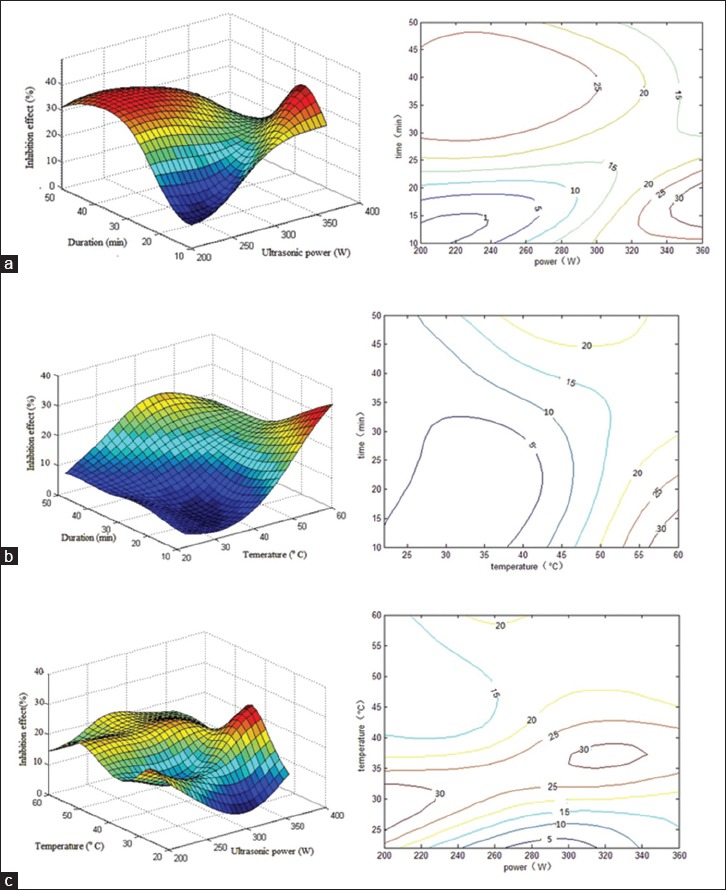
Figure 3.

Response surface plot showing the effects of ultrasonication power and duration on the inhibition of nonenzymatic glycosylation. The corresponding two-dimensional elevation chart is shown on the left. Experimental and predicted data and conditions are shown in Table 3. (a) Ultrasonication temperature was kept constant at 22°C; (b) ultrasonication power was kept constant at 230 W; (c) temperature was kept constant at 50 min
