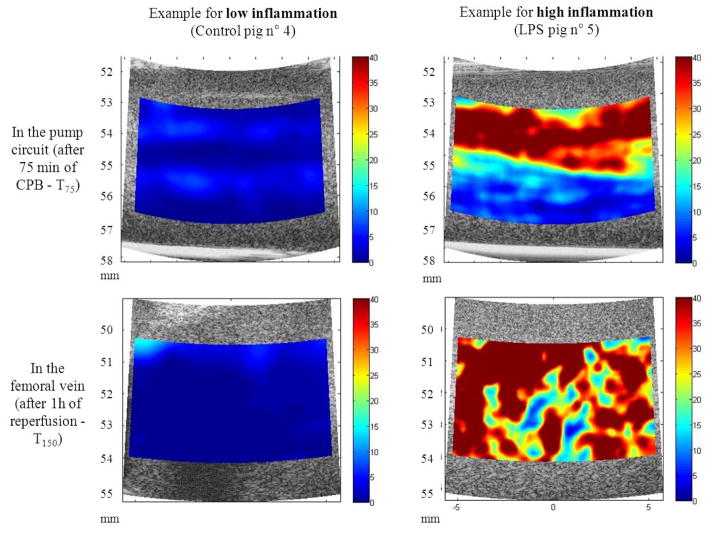
Fig. 10.
Examples of Structure Factor Size and Attenuation Estimator parametric images of red blood cell aggregation (W, longitudinal views) in case of low (left) and high inflammation (right). Data were acquired within the pump circuit deviation (top) and the femoral vein (bottom). The color maps vary from 0 (blue) to 40 (red). Variable W has no unit. LPS = lipopolysaccharide; CPB = cardiopulmonary bypass. (Adapted from [143]).

