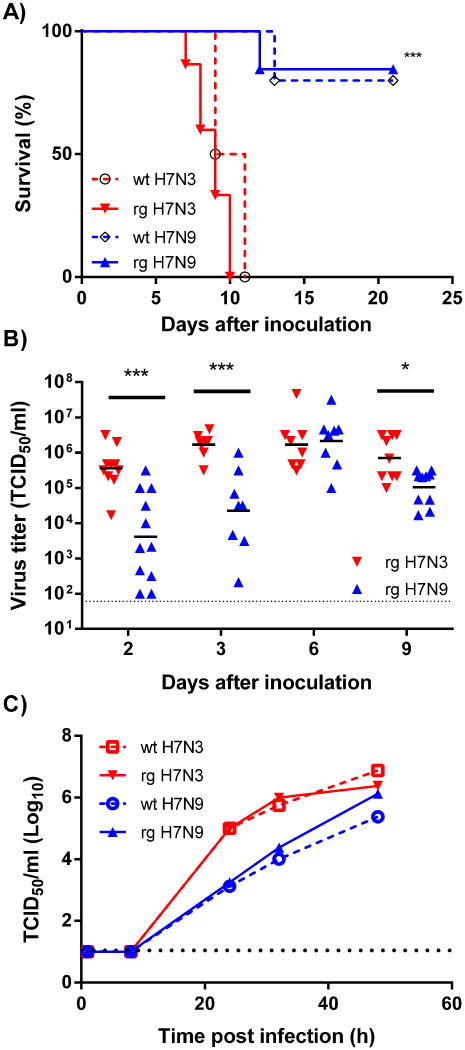
Figure 1. Characterization of H7N3 and H7N9 Influenza A virus.
(A) Wild-type and plasmid-derived H7N3 and H7N9 influenza A virus were used to inoculate 6-8 week old female DBA/2J mice and mortality was observed for 21 days. (B) Virus titers in lungs homogenates of H7N3 and H7N9 infected DBA/2J mice. Male DBA/2J mice were inoculated with 103 TCID50 of H7N3 or H7N9 virus and lungs were harvested at 2, 3, 6, and 9 days post inoculation. Lung virus titers were quantified on MDCK cells. (C) MDCK cells were inoculated with an MOI of 0.0001 and the virus titer in the supernatant was quantified at 6, 24, 32 and 48 hours post infection on MDCK cells. The data (TCID50/ml) is the average of two wells per virus and is representative of two experiments. Dotted line is the limit of detection. ** = P<0.01; *** = P<0.001

