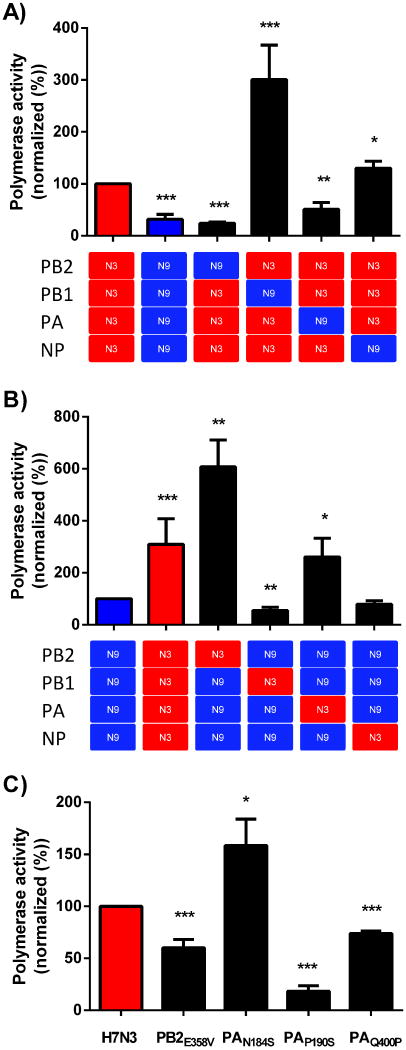
Figure 4. H7N9 influenza A virus demonstrates reduced polymerase activity.
293T cells were transfected with expression plasmids (pcDNA3.1) encoding the PB2, PB1, PA, and NP protein of H7N3 (red squares), H7N9 (blue squares), or a mutated PB2 or PA protein of influenza A virus in addition to a vector producing an influenza virus like gene-segment containing the firefly luciferase protein in the negative orientation and a transfection control plasmid encoding for the Renilla luciferase protein. Forty-eight hours later the amounts of firefly and Renilla luciferase protein activity is quantified. The results are normalized based on Renilla luciferase activity and compared to the polymerase activity of H7N3 (A and C) or H7N9 (B) polymerase genes. The data represents the mean relative activity + SD from three or more independent experiments in duplicate. * = P<0.05; ** = P<0.01; *** = P<0.001 compared to H7N3 (A) or H7N9 activity (B).

