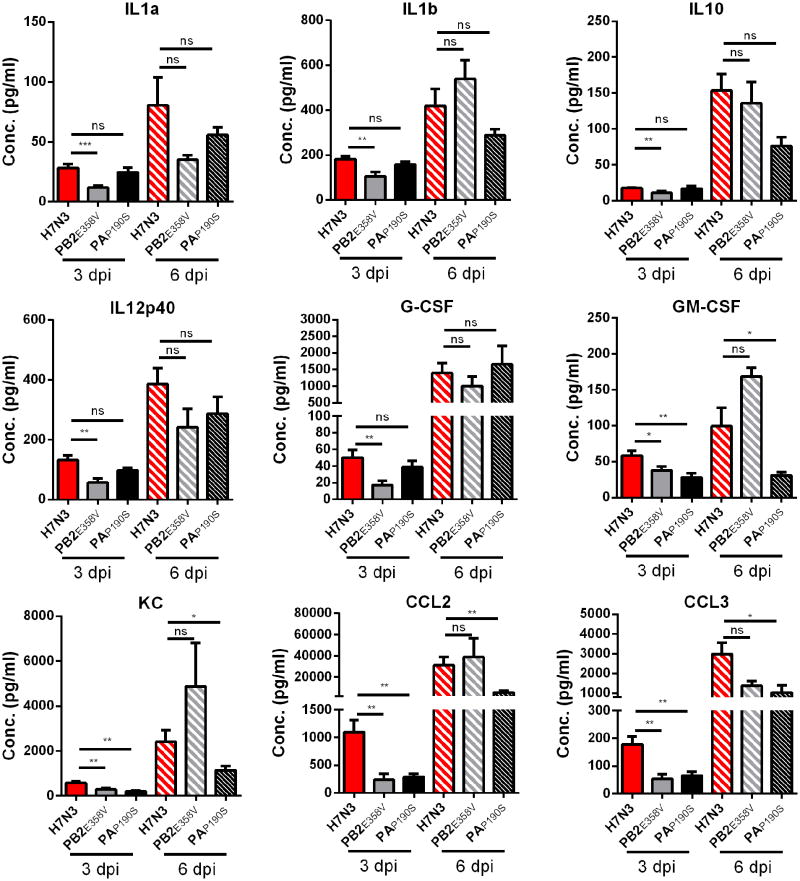
Figure 7. Cytokine and chemokine concentration in lung homogenates after H7N3, H7N3-PB2E358V, and H7N3-PAP190S virus infection.
Male DBA/2J mice were inoculated with 100 TCID50 of the H7N3, H7N3 PB2E358V, or H7N3 PAP190S and lungs were collected at 3 and 6 days post infection (dpi). The tissue was homogenized in 1.0ml of PBS and used for cytokine and chemokine quantification. The results are the average plus standard error of the mean of at least seven mice from two different experiments. * = P<0.05; ** = P<0.01; *** = P<0.001; ns = not significant.

