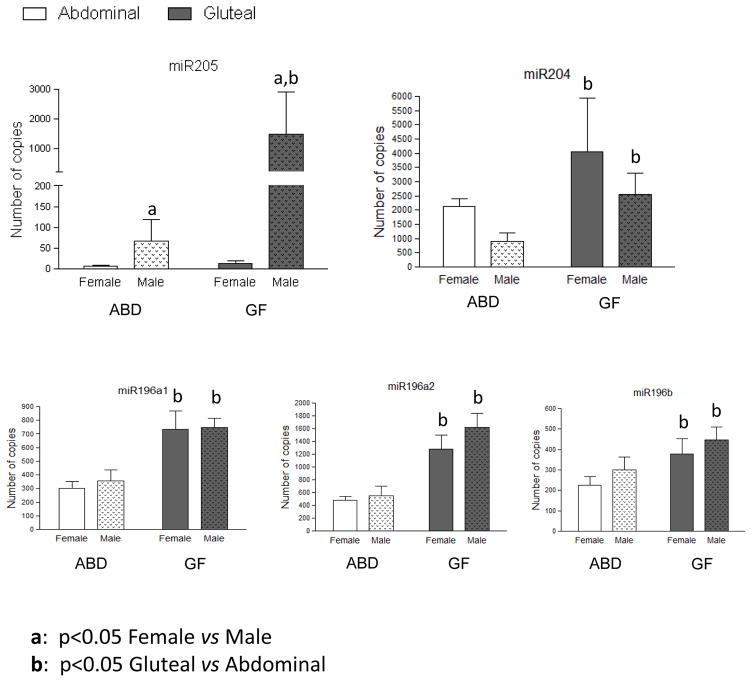
Figure 2. miRSequencing quantification for three selected microRNAs differentially expressed between Abdominal (white bars) and Gluteal (grey bars) subcutaneous adipose tissue split by sex.
Data are presented as mean ± SEM of females (n=9) and males (n=9). GF: Gluteofemoral depot – Abd: Abdominal depot

