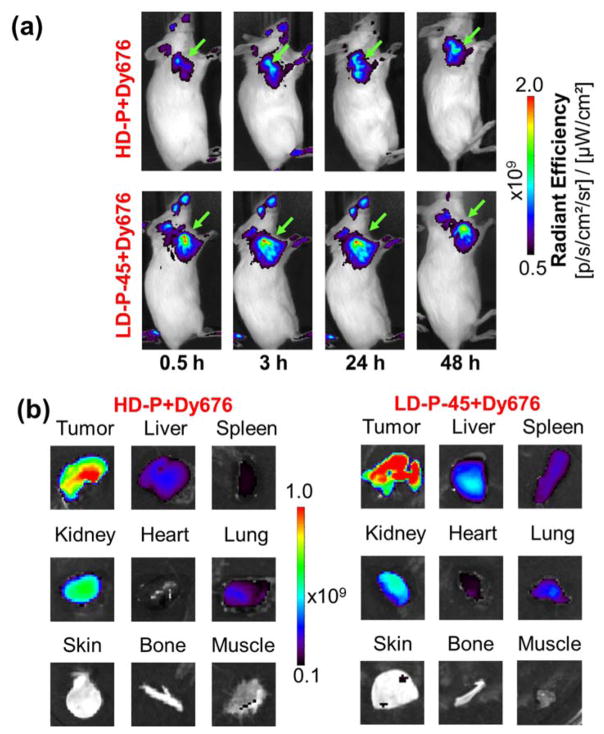
Figure 8.
In vivo and ex vivo optical imaging. (a) Serial in vivo optical imaging of 4T1 tumor-bearing mice injected with HD-P+DY-676 (upper panel) and LD-P-45+DY-676 (lower panel) at 0.5 h, 3 h, 24 h and 48 h p.i. (b) Ex vivo images of tumor and major organs, 48 h p.i. of the tracers. Images are representative of 3 mice per group. Green arrowheads indicate the position of 4T1 tumor.

