
Figure 3. T-Tubular network distribution of NKA isoforms.
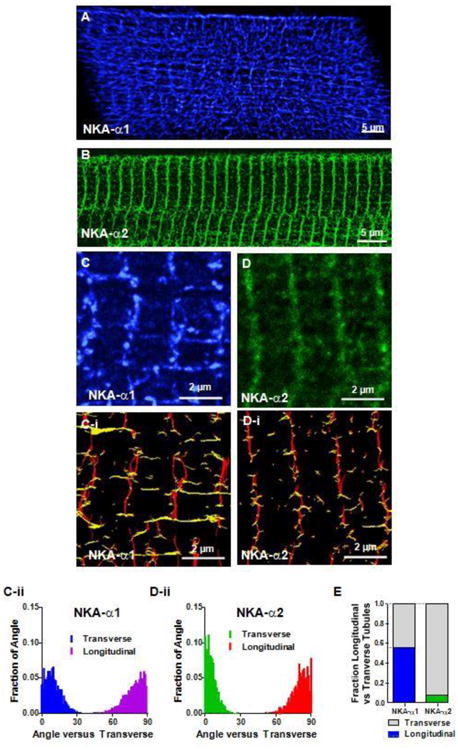
The TT network was revealed in stacks of STED images by removing the 0.66 μm thick outer SSL surface shell (converse of Figure 2A-B). A B: NKA-α1 and NKA-α2 fluorescence signal from inner TT structures, respectively. 3D reconstructions by volume rendering (with an adapted opacity transfer function) showing α1 presence throughout this intricate tubular network (A), while α2 is mainly in the transverse direction (B). C, D: Maximum intensity projections of slabs of TT network show that α1 (3 μm thick) contains multiple longitudinal elements spanning multiple TTs while α2 (1.1 μm thick) is more exclusively in the transverse elements. C-i, D-i: Orientation analysis based on Riesz transform representations (of C and D) categorizing cluster segments as either transverse (red) or longitudinal (yellow). C-ii, D-ii: Length and orientation of each segment were measured in C-i, D-I, and the fractions of segments at each angle versus transverse (regardless the segment length). Each distribution totals 1 (Transverse or Longitudinal); n = 3 cells. E: Orientation of segments with length > 0.6 μm, showing predominantly transverse orientation for α2 and nearly equal amounts longitudinal and transverse for α1. (n = 3 cells.