
Figure 5. Distribution of NKA isoforms at subsurface.
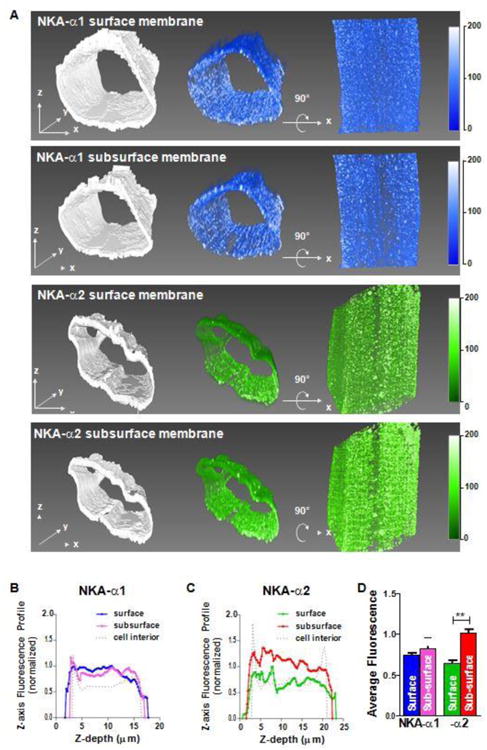
Myocyte surface shell and subsurface shells (0.9 μm thick) were segmented from STED image stacks. A Top row is NKA-α1 SSL shell with binary mask for segmentation (left), corresponding volume rendering of fluorescence (middle) and the same volume rotated 90° around the x-axis (right). Second row is NKA-α1 Sub-SSL with the same layout as the previous row. Last two rows show NKA-α2 SSL and subsurface, respectively. All volumes were rendered with the same opacity transfer function for consistency in fluorescence intensity scale. B, C: Shell fluorescence profiles for α1 (B) and α2 (C) with respect to distance above the bottom surface (normalized to peak surface intensity). Signal attenuation from light scattering and absorption with increasing depth was not corrected. Surface and Sub-subsurface signal are similar for α1, but for α2 Sub-surface is higher than Surface. D: Average fluorescence signals for α1 and α2. (n = 3 cells; statistical analysis: t-test)