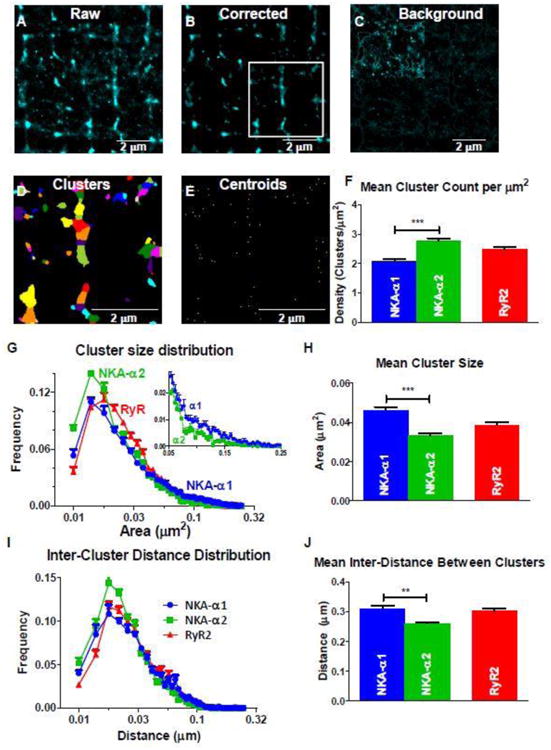
Figure 7. NKA cluster characteristics in STORM images.

A-C: Raw (A) and corrected (B) STORM RyR2 (Alexa Fluor 568) reconstructed image based on blinks from 10,000 frames, and the subtracted background image (C) used for correction. Background signal included points with less than 90 percentile of fluorescent intensity and cluster size (>25 nm2). Upper left quadrant in C is increased 3-fold in intensity to better visualize the lack of structural organization in the background signal. D: Corrected Image with individual STORM clusters identified (by color). Clusters are identified based on peak intensity values with Gaussian distributions (or centroids) indicated in E). Each centroid corresponds to an individual cluster in panel D. F: density (per μm2) of α1, α2, and RyR2 clusters in the TT region. G, H: Cluster size frequency histogram (G) shows similar modes between (near 0.014 μm2) for α1, α2, and RyR2, but mean cluster size for α1 is larger than for α2 (H). Inset in G shows a slightly larger distribution of larger clusters in α1. I, J: Inter-cluster distance (between centroids) frequency histogram (I) and mean values (J) for α1, α2, and RyR2 clusters. Modes for α1 and α2 were identical (0.018 μm), but for α1 more long distances contribute to a larger mean value. (n = 11 (α1), 9 (α2), and 20 (RyR2) cells; statistical analysis: t-test)
