
Figure 8. T-Tubular NKA isoform localization near RyR2.
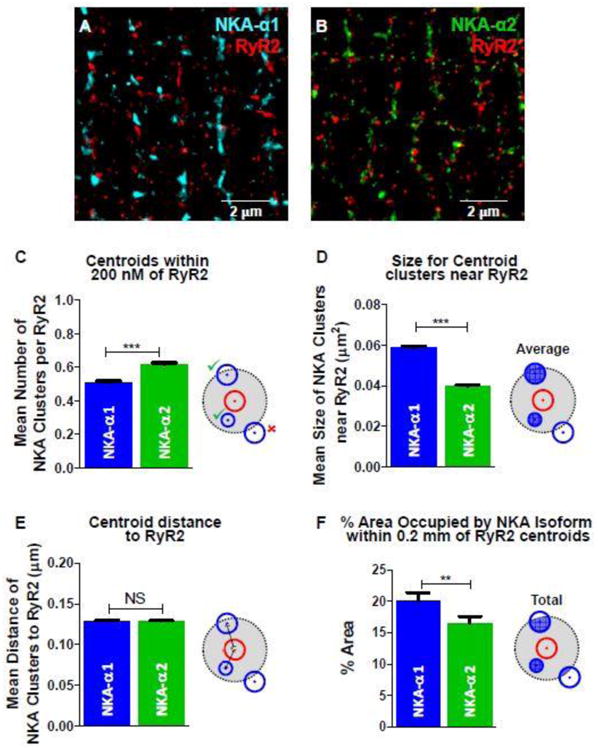
A: STORM image of NKA-α1 (Alexa Fluor 647; blue) and RyR2 (Alexa Fluor 568; red). B: STORM image of NKA-α2 (Alexa Fluor 647; green) and RyR2 (Alexa Fluor 568; red). C: Mean number of NKA isoform cluster centroids within 0.2 μm radius of each RyR2 cluster centroid (illustration of analysis criteria at right). D: Mean size of NKA isoform clusters whose centroids are within 0.2 μm radius of the RyR2 cluster centroid. E: Mean distance between RyR2-NKA cluster centroids within 0.2 μm radius of RyR2 clusters (0.13 μm for both). F: Mean total area of NKA cluster within 0.2 μm radius of RyR2 clusters, as percentage the total 0.2 μm radius circle. This area includes portions of any NKA clusters within 0.2 μm radius of RyR2 clusters. (n = 11 (α1), 9 (α2), and 20 (RyR2) cells; statistical analysis: t-test)