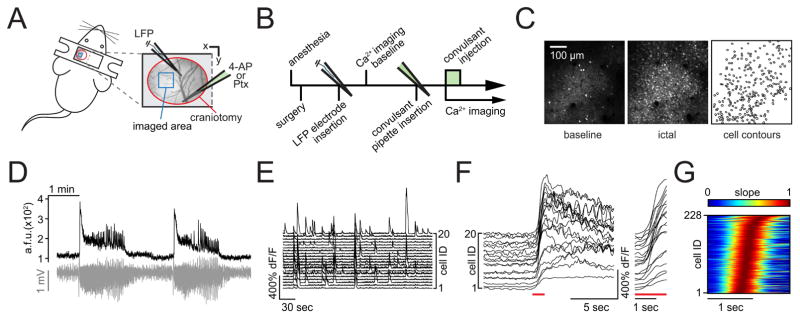
Figure 1. In vivo two-photon calcium imaging of seizure spread with single cell resolution.
(A) Experimental setup with surgical approach over left somatosensory cortex; craniotomy encircled in red, imaged field of view (FOV) within the seizure propagation area in blue; each experiment (‘exp.’) involved the insertion of two glass micropipettes, one (blue) containing a silver chloride electrode for LFP (local field potential) recording, the other (green) containing 4-AP (15 mM, injection vol. 500 nl [total amount delivered = 7.5 nmol]) or Ptx (10 mM, injection vol. 500 nl, [total amound delivered = 5 nmol]). (B) Typical experimental workflow. (C) Propagation area in left somatosensory cortex, representative 3 sec average (avg) fluorescence images of neural activity (GCaMP6s) during baseline (left) and full ictal event (middle, see also movie S 1.1); contour plot of registered cells (right). (D) Avg calcium transient of FOV (black trace, GCaMP6s, imaging depth ~150μm beneath the pial surface) and corresponding LFP (gray trace) post 4-AP. (E) Calcium transients of 20 representative cells within FOV during baseline. (F) The same 20 cells post 4-AP, optical seizure break-in (underlined in red) magnified on the right. (G) Representative example of the optical break-in of the ictal wave. Normalized first derivative of ΔF/F. Cell recruitment to ictal activity ordered in time by maximum slope.

