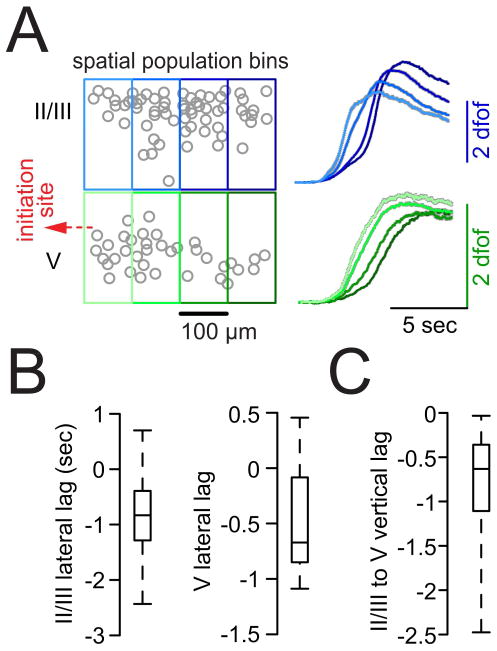
Figure 4. Supragranular layers are systematically recruited ahead of deep layers.
(A) Left: Paradigmatic multilayer contour plot (LII/III and LV, circles represent individual cells). Small local cell populations were grouped together in spatial bins (tiles) of 100 μm width to assess lateral delays of adjacent tiles and vertical delays of tiles situated above each other. Right: Population avg calcium transients of individual tiles within LII/III or LV across all seizures in one exp. (right, gray shades represent s.e.m., # of seizures = 11, # of analyzed cells = 102, # of spatial tiles = 8). Note that lateral but also vertical tile delays can be appreciated by eye. (B–C) Box plots of lateral (tile[prox]-tile[dist]) or vertical (tile[LII/III]-tile[LV]) recrutiment time lags of adjacent tiles (see also Figure S3 D and SI); boxes represent 25%ile to 75%ile, bands inside boxes display the median recruitment time lag (n = 4 exp., total # of seizures = 32 [8 ± 3.6 s.e.m.]). In nearly all seizures proximal tiles (lateral lag) were recruited prior to their adjacent distal tiles (for lateral lags LII/III and LV: Chi-Square test X2(1) = 12.7, p<0.001); in all seizures LII/III tiles were recruited prior to their corresponding LV tiles (X2(1) = 21.3, p<0.001).

