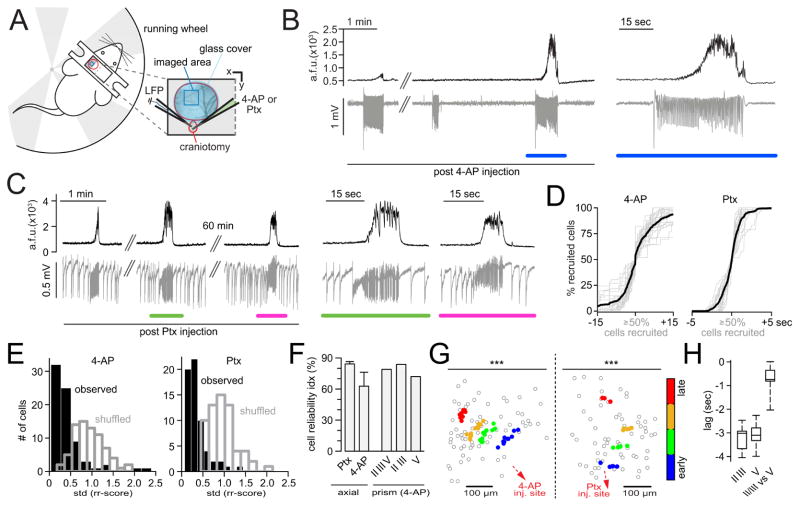
Figure 5. Stereotypical and elastic seizure propagation in awake mice.
(A) Adapted experimental setup; craniotomy outlined in red, FOV in dark blue; glass cover slip in light blue. Two inserted glass pipettes (LFP [blue], 4-AP or Ptx [green, 4-AP: 500 nl, total amount delivered = 7.5 nmol; Ptx: 10mM, 500 nl, total amount delivered = 5 nmol]) (B) Avg population calcium transient (black trace, Thy-1::GCaMP6f, LII/III) and corresponding LFP (gray trace) post 4-AP (~2mm posterior to FOV in somatosensory cortex). Blue underscore marks magnified inset on the right (C) Avg population calcium transient (black trace, Thy-1::GCaMP6f, LII/III) and corresponding LFP (gray trace) post Ptx (~1.5mm posterior to FOV in somatosensory cortex). Green and magenta mark magnified insets on the right. Note the stable lack of calcium responses to IIS in the LFP and slow seizure invasion of the FOV post Ptx. (D) Superposition of all axially imaged seizures (gray) in awake mice, post 4-AP or Ptx, centered around the 50% recruitment frame; black graphs represent mean temporal recruitment (4-AP: n = 5 exp., total # of seizures = 26, total # of cells analyzed = 359 [72 ± 8 s.e.m.], Ptx: n = 3 exp., total # of seizures = 19, total # of cells analyzed = 182 [61 ± 1 s.e.m.]); cell number in % for comparability across exp.. (E) Representative exp. (4-AP or Ptx) with observed (black) versus shuffled (gray) rr-score std distributions. Both seizure models show left-ward shifts of the observed versus shuffled data. (F) Cellular reliability indices (rr-score) across seizure models. Ptx (n = 3 exp., axial imaging), 4-AP (n = 5 exp. axial imaging, 1 exp. multilayer imaging). (G) Representative exp. (4-AP or Ptx): spatial avg coordinates of temporally defined population quartiles (colored dots), plotted within the imaged population (gray circles represent individual cells). Left: 4-AP (bivariate ANOVA: n=11 seizures, F[3,40] = 18.44, p = 1×10⁻⁷, all 5 exp. in awake mice with 4-AP p<0.001). Right: Ptx (bivariate ANOVA: n=4 seizures, F[3,12] = 52.87, p = 1.5×10⁻⁸, all 3 exp. in awake mice with Ptx p<0.001) (H) Multilayer imaging. Box plots of lateral or vertical onset time lags of adjacent tiles (please see also Figure S3 D); boxes represent 25%ile to 75%ile, bands inside boxes display the median recruitment time lag (1 exp., 4-AP, total # of seizures = 7).

