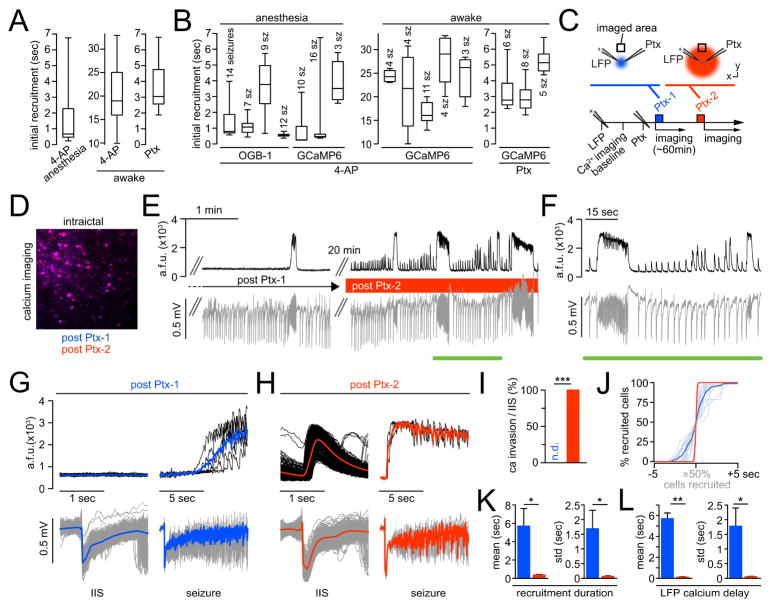
Figure 6. Elastic recruitment is regulated by local inhibitory neurons.
(A) Absolute ictal recruitment durations vary across seizures. Box plots displaying population recruitment durations analyzed for each condition. Left: 4-AP under isoflurane (7 exp., 71 seizures). Middle: 4-AP during wakefulness (5 exp., 26 seizures). Right: Ptx during wakefulness (3 exp., 19 seizures). (B) Ictal recruitment durations vary within individual exp.. Box plots of 15 exp. (7 anesthesia, 8 wakefulness): Boxes represent 25%ile to 75%ile of cellular recruitment, bands inside boxes display median cell recruitment time. (C) Schematic depiction of exp. involving two Ptx injections during wakefulness: LFP and Ptx pipettes are located within the seizure initiation site. After LFP pipette insertion and baseline imaging, the Ptx (10mM) pipette is inserted. The 1st Ptx injection (‘Ptx-1’, blue) is volume controlled, as usual (500 nl, total amount delivered = 5 nmol]), and followed by imaging seizure spread, as described, for ~60min. Then, a 2nd Ptx injection (‘Ptx-2’, red) is performed (pressure controlled, 10 psi, 10min). (D) Merged avg images of ictal FOV post Ptx-1 (blue) and post Ptx-2 (red). Note the complete overlap of the avg images (magenta), that is, the imaged focal plane remains stable beyond Ptx-2. (E) Representative experiment. Left: Post Ptx-1, imaging (black) and LFP recordings (gray) of spreading seizures for >1hr (note: no calcium response to IIS in the LFP). Right: ~20 min post Ptx-2. (F) Magnification of inset in E. Note that post Ptx-2, every IIS in the LFP coincides with a population calcium response within the FOV in the propagation area. (G) Same exp., post Ptx-1. Left: Superimposed 2-sec windows of population calcium activity (top, individual traces in black, mean in blue) centered around 678 IIS recorded by LFP at the distant injection site (bottom, individual events in gray, mean in blue). Right: Superimposed 10-sec windows of 6 seizures recorded by imaging (top, individual seizures in black, mean in blue) and LFP (bottom, individual seizures in gray, mean in blue). Note the delay of several sec between electrographic seizure onset and optical invasion. (H) Same exp., post Ptx-2. Left: Superimposed 2-sec windows of population calcium activity (top, individual traces in black, mean in red) centered around 562 IIS (bottom, individual events in gray, mean in red). Right: Superimposed 10-sec windows of 3 seizures recorded by imaging (top, individual seizures in black, mean in red) and LFP (bottom, individual seizures in gray, mean in red). Note the clear population calcium response to IIS in the LFP and the immediate penetration of the imaged FOV upon electrographic seizure onset. (I) Quantification of optical invasion per IIS (n=4 exp., 1327 IIS post Ptx-1 [n.d. = none detectable], 893 IIS post Ptx-2 [mean invasion rate = 100%], Mann Whitney test: p = 0). (J) Superposition of all optical invasions during electrographic seizures (n=4 exp.; post Ptx-1: 21 seizures, individual events in light blue, mean in dark blue; post Ptx-2: 17 seizures, individual events in light red, mean in dark red) centered around the 50% recruitment frame of the population. Cell number in % for comparability across exp.. Note how the slow, s-curved population recruitment curve upon Ptx-1 changes into a near step-like function post Ptx-2. (K) Quantitative comparison of absolute population recruitment duration and duration standard deviation (std) of the Ptx-1 (blue) versus Ptx-2 (red) condition (n=4 exp., Ptx-1/Ptx-2: 21/17 seizures): mean recruitment duration (5.696 ± 1.915 vs. 0.375 ± 0.052 sec, Mann Whitney test: p = 0.0286), mean recruitment duration std (1.69 ± 0.625 vs. 0.068 ± 0.024 sec, p = 0.0286). (L) Quantitative comparison of absolute time delay and delay std of optical invasion after electrographic seizure onset of the Ptx-1 (blue) versus Ptx-2 (red) condition (n=4 exp., Ptx-1/Ptx-2: 21/17 seizures): mean delay (5.7 ± 0.538 vs. 0.116 ± 0.038 sec, Mann Whitney test: p = 0.002), mean delay std (1.78 ± 0.62 vs. 0.055 ± 0.012 sec, p = 0.0286).

