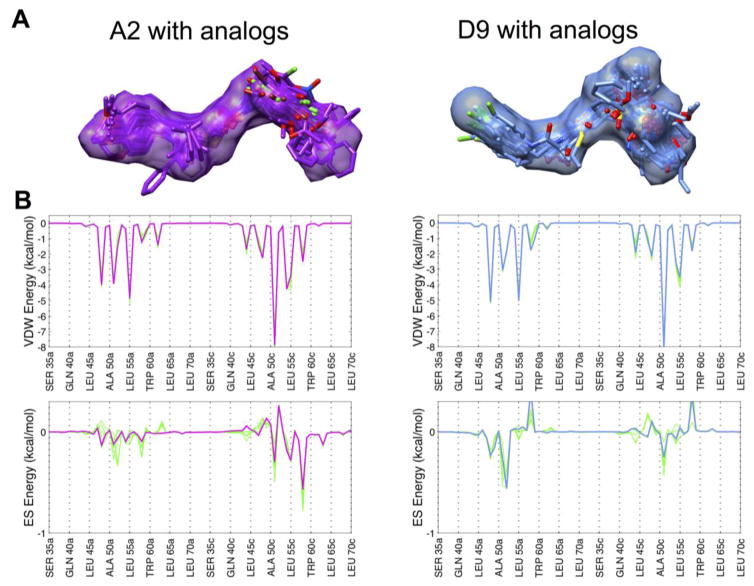
Figure 2.
(A) The 3D predicted binding geometries for A2 (purple surface) and D9 (light blue surface) with each group of analogs (colored sticks). (B) Comparison of van der Waals and electrostatic footprints of A2 (purple) and D9 (light blue) with the top 5 analogs (green) showing the best overlap in each case. A distant-dependent-dielectric cutoff (ddd=4r) was used to compute the electrostatic footprint score.

