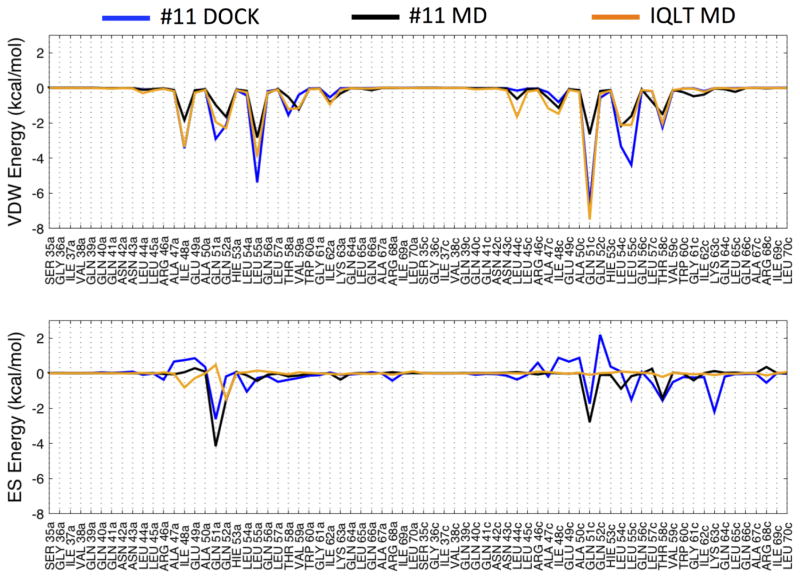
Figure 8.
Footprint comparison for the original DOCK pose of #11 (blue), six MD-averaged trajectories of #11 (black) and time-averaged trajectory of the IQLT peptide reference20 (orange) segmented into van der Waals (top) and electrostatic components (bottom). For consistency with Allen et al20 electrostatics were computed without a distant-dependent-dielectric cutoff.

