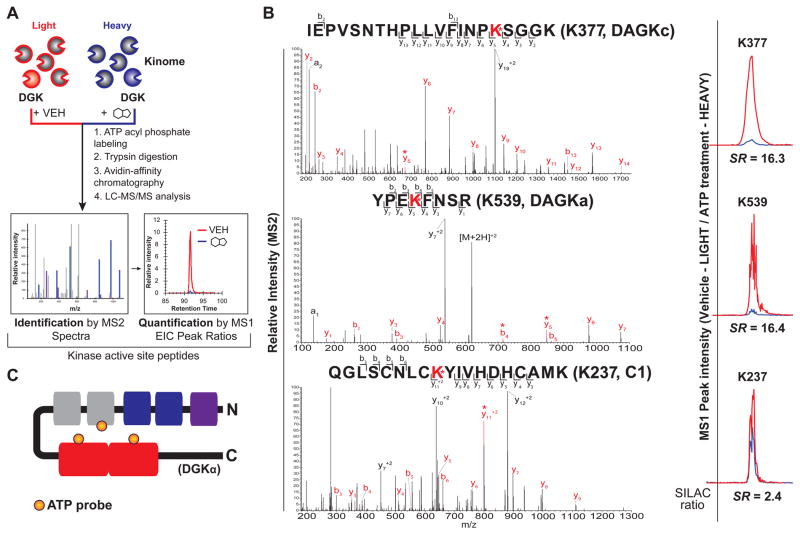
Figure 4. Elucidation of ATP and ligand-binding sites of DGKα by quantitative chemical proteomics.
(A) Schematic of quantitative LC-MS proteomics workflow to identify ligand binding sites of recombinant DGKs using ATP acyl phosphate probe. See STAR Methods for more details. (B) Left - MS2 spectra of probe-modified peptides corresponding to the active site of DGKα. Major b- and y-ion fragments derived from neutral losses of the precursor (M) are indicated on spectrum in red. An asterisk denotes fragments containing probe-modified lysine residues corresponding to the red-labeled lysine shown in the peptide sequence. Right - MS1 extracted ion chromatograms of probe-modified peptides with corresponding SILAC ratios quantifying vehicle-treated (light): compound-treated (heavy). (C) Schematic of DGKα showing domains where ATP probe binding is detected by quantitative chemical proteomics. Orange circles represent ATP probe binding at K237 of the C1 domain, K377 of the DAGKc domain, and K539 of the DAGKa domain.

