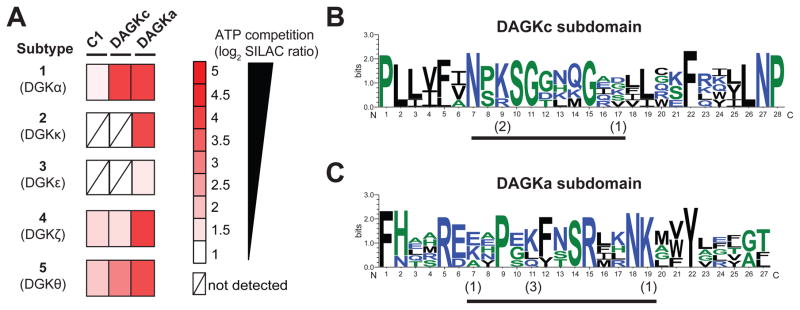
Figure 5. Chemical proteomic profiling of the DGK superfamily.
(A) Heatmap showing SILAC ratios for probe-binding sites of respective DGK isoforms in ATP (1 mM, 30 min)- versus DMSO vehicle-treated recombinant HEK293T proteomes. DGK ATP binding sites are defined by SR > 5. (B–C) Sequence similarity of ATP binding sites of DGK isoforms measured by quantitative proteomics. Multiple sequence alignments of probe-modified peptides were performed using Clustal Omega and results analyzed by sequence logos (See STAR Methods for details) to search for common motifs within the DAGKc (B) and DAGKa (C) ATP-binding sites of DGKs. The height of each stack denotes sequence conservation at the respective position (measured in bits). The height of individual residues within the stack indicates the relative frequency of corresponding amino acids at that position. The numbers in parentheses indicate the number of DGKs that show modification at the respective probe-modified lysine. Color scheme for amino acids in sequence logos is as follows: hydrophilic, blue; neutral, green; hydrophobic, black. Probe modified peptides used for sequence alignment and logo analysis can be found in Figure S6 and Table S1.

