Figure 2.

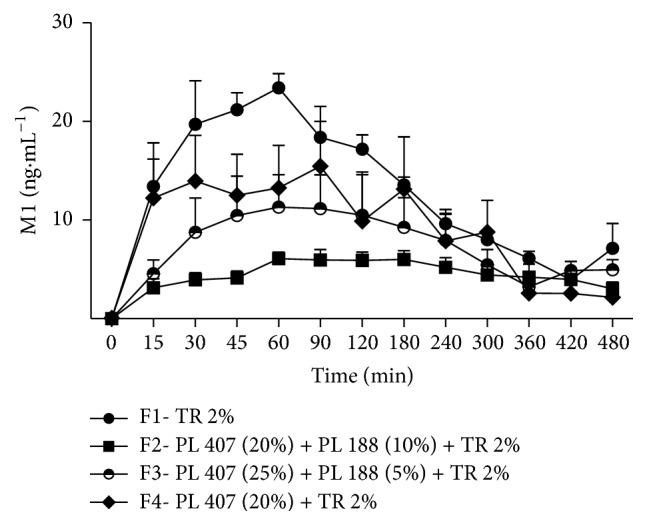
Time-course (min) of M1 after the injection of TR formulations in rabbits. Values are expressed as mean ± SD. F2 < F1 until 120 minutes (p < 0.05); F4 < F2 after 15, 30, and 90 minutes (p < 0.05).

Time-course (min) of M1 after the injection of TR formulations in rabbits. Values are expressed as mean ± SD. F2 < F1 until 120 minutes (p < 0.05); F4 < F2 after 15, 30, and 90 minutes (p < 0.05).