
Figure 1. Personal Health Care Spending in the United States by Age Group, Aggregated Condition Category, and Type of Health Care, 2013.
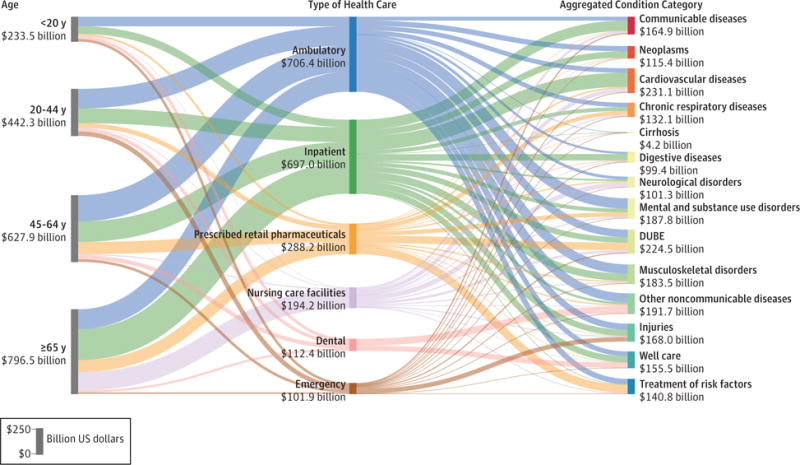
DUBE indicates diabetes, urogenital, blood, and endocrine diseases. Reported in 2015 US dollars. Each of the 3 columns sums to the $2.1 trillion of 2013 spending disaggregated in this study. The length of each bar reflects the relative share of the $2.1 trillion attributed to that age group, condition category, or type of care. Communicable diseases included nutrition and maternal disorders. Table 3 lists the aggregated condition category in which each condition was classified.