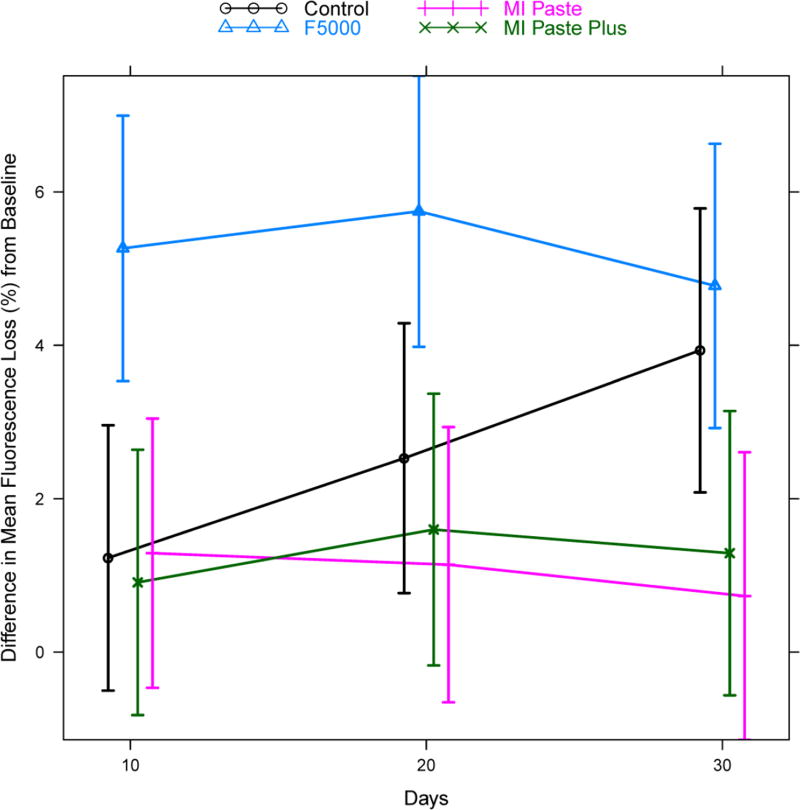
Figure 4.
Model predicted estimates of the mean difference in fluorescence loss from baseline, for each treatment group at each follow-up time point. Estimates were based on the hierarchical random effects model with random effects for tooth and specimen nested within tooth and fixed effects for treatment, time, and treatment*time interaction. Vertical bars indicate model based estimates of 95% confidence intervals for the mean difference from baseline. Points are slightly staggered at each time point for better visualization of the vertical bars.

