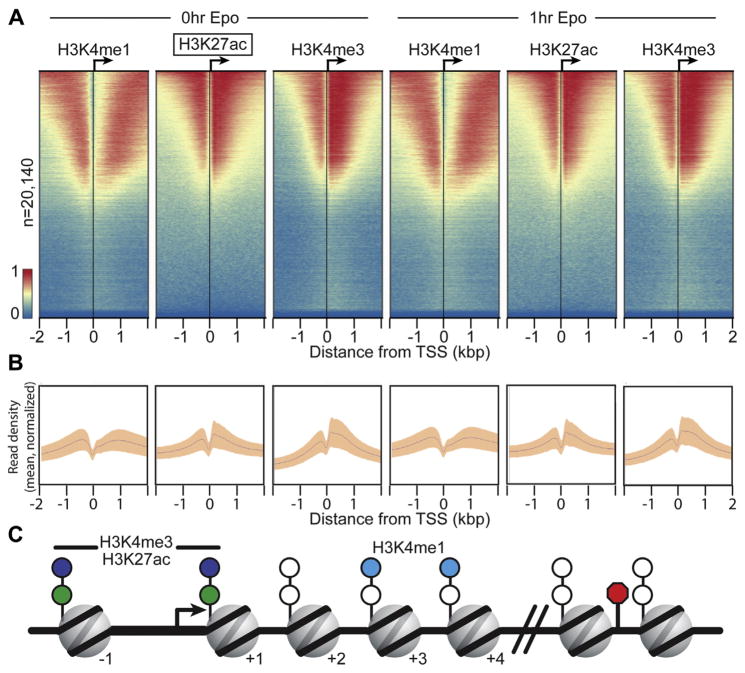
Figure 2.
ChIP-exo reveals histone modification patterns at gene promoters. (A) ChIP-exo libraries were prepared for H3K4me1, H3K27Ac, and H3K4me3 and visualized using ChAsE [89]. Aligned heatmaps indicate RPKM normalized number of reads across a 4-kb genomic interval in 20-bp bins relative to the TSS before and after Epo stimulation. Regions are sorted in descending order based on average row tag density for 0-hour H3K27ac. Each row represents one protein-coding gene, with 20,140 lines/genes present. Red and blue reflect high and low read densities, respectively. (B) Composite plots below each heatmap quantify the normalized tag density. The central trace denotes the average tag density for each 20-bp bin, and the orange fill reflects the standard deviation. (C) Model illustrating the nucleosome position for enriched histone marks, which are derived from the tag enrichment patterns in (A) and Supplementary Figure E2 (online only, available at www.exphem.org).

