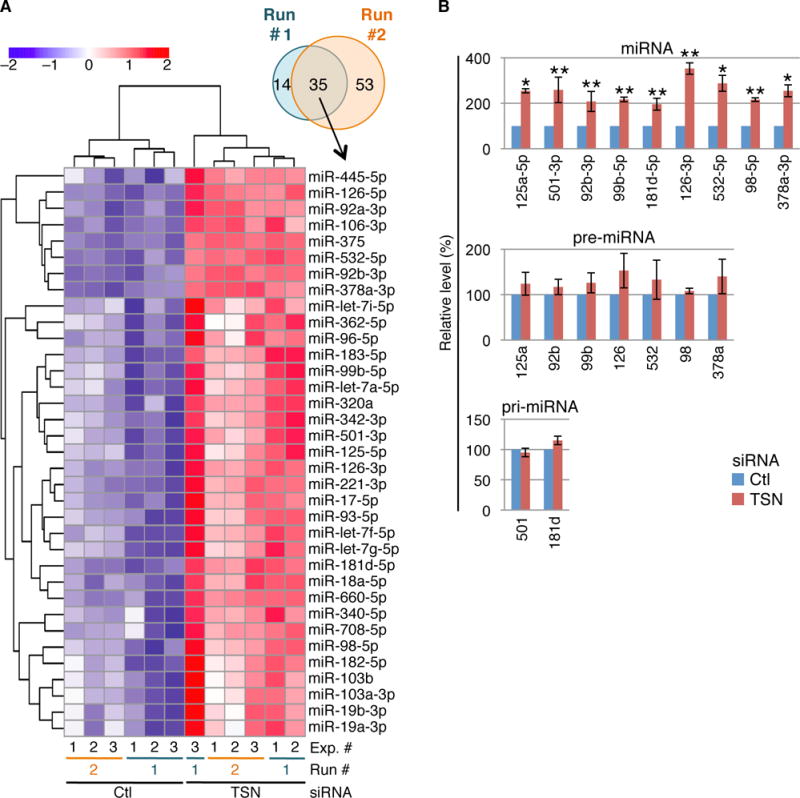
Fig. 2. miR-seq, combined with RT-qPCR, defines HEK293T-cell TumiD targets.

(A) Venn diagram and heat map of miRNA expression from miR-seq Runs #1 and #2 (Tables S3 and S4), identifying miRNAs exhibiting significant upregulation upon TSN KD. Color key represents row-scaling of the batch-corrected DESeq rLog-transformed expression values.
(B) RT-qPCR corroboration of miR-seq data defines miRNAs that are upregulated upon TSN KD without significant changes in the levels of their pre-miRNAs or, when pre-miRNAs were undetectable, pri-miRNAs.
