
Figure 5.
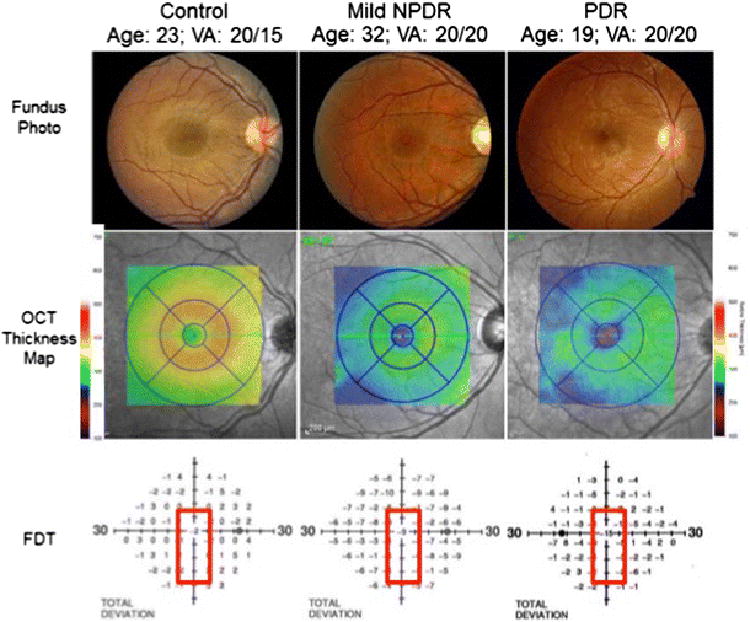
Color fundus photographs (top panel) of a healthy person (left), a person with mild non-proliferative diabetic retinopathy (NPDR) (middle), and a person with proliferative diabetic retinopathy (PDR) (right) demonstrate preserved macular anatomy without gross vascular compromise and visual acuities 20/20 or better. Spectral-domain optical coherence tomography (OCT) macular thickness mapping (central panel) demonstrates foveal and parafoveal thicknesses reduced by between 50 and 75 microns comparing healthy eyes to those with mild NPDR or PDR. The lower panel demonstrates a concomitant decline in foveal sensitivities in the diabetic patients as measured by frequency doubling perimetry, with a 9 decibel (dB) visual field sensitivity loss in the patient with mild NPDR and a 15 dB sensitivity loss in the patient with PDR.