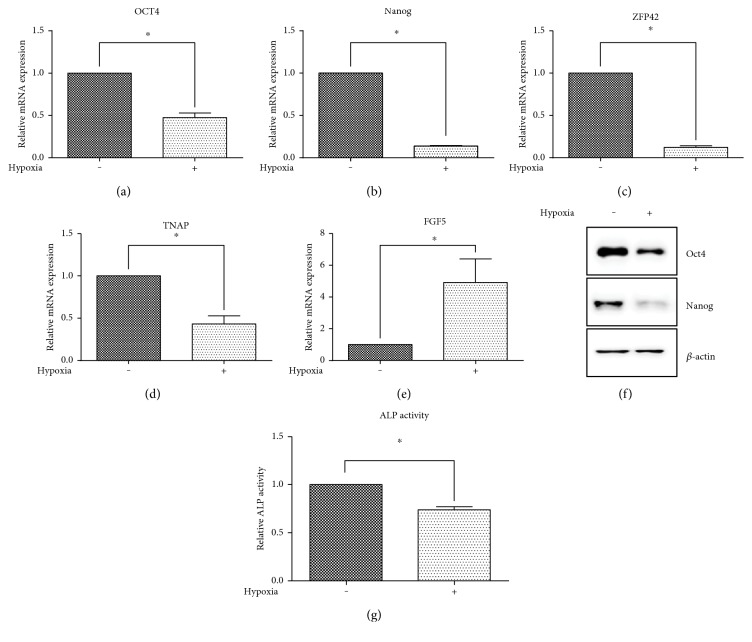
Figure 7.
Relative expression of OCT4 (a), NANOG (b), ZFP42 (c), TNAP (d), and FGF5 (e) in wild-type ES cells determined by qRT-PCR. Data are presented as mean + SEM from at least three independent experiments. Statistical significance was determined by T test (∗P < 0.05). Protein level of Oct4 and Nanog in wild-type ES cells cultivated in normoxia or hypoxia as determined by western blot (f). Total level of β-actin was used as a loading control. Determination of alkaline phosphatase activity in wild-type ES cells cultivated in normoxia or hypoxia (g). Data are presented as mean + SEM from at least three independent experiments. Statistical significance was determined by T test (∗P < 0.05).

