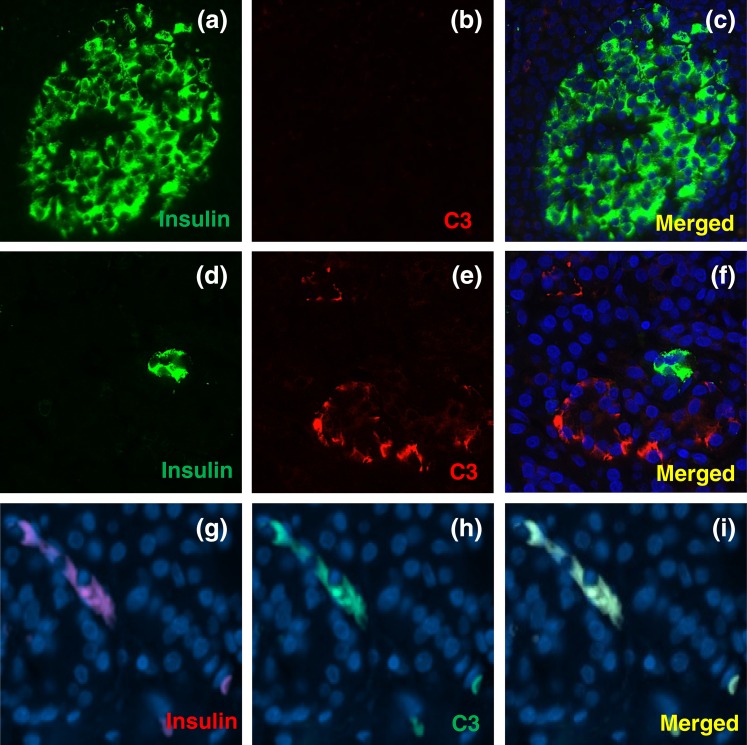
Figure 3.
C3 expression in pancreas sections from nondiabetic and type 1 diabetic donors. (a–f) Pancreas sections from the nPOD cohort were analyzed by immunofluorescence. (a–c) Nondiabetic control and (d–f) type 1 diabetic donors were stained for (a and d; green) insulin, (b and e; red) C3, and (c and f; blue) HO. (g–i) Pancreas sections from a type 1 diabetic patient from the University of Pisa cohort were stained for (g; red) insulin, (h; green) C3, and (i; yellow) merged. DAPI staining is shown in blue. Images are representative of four nondiabetic subjects and three individuals with T1D. Original magnification, ×40.

