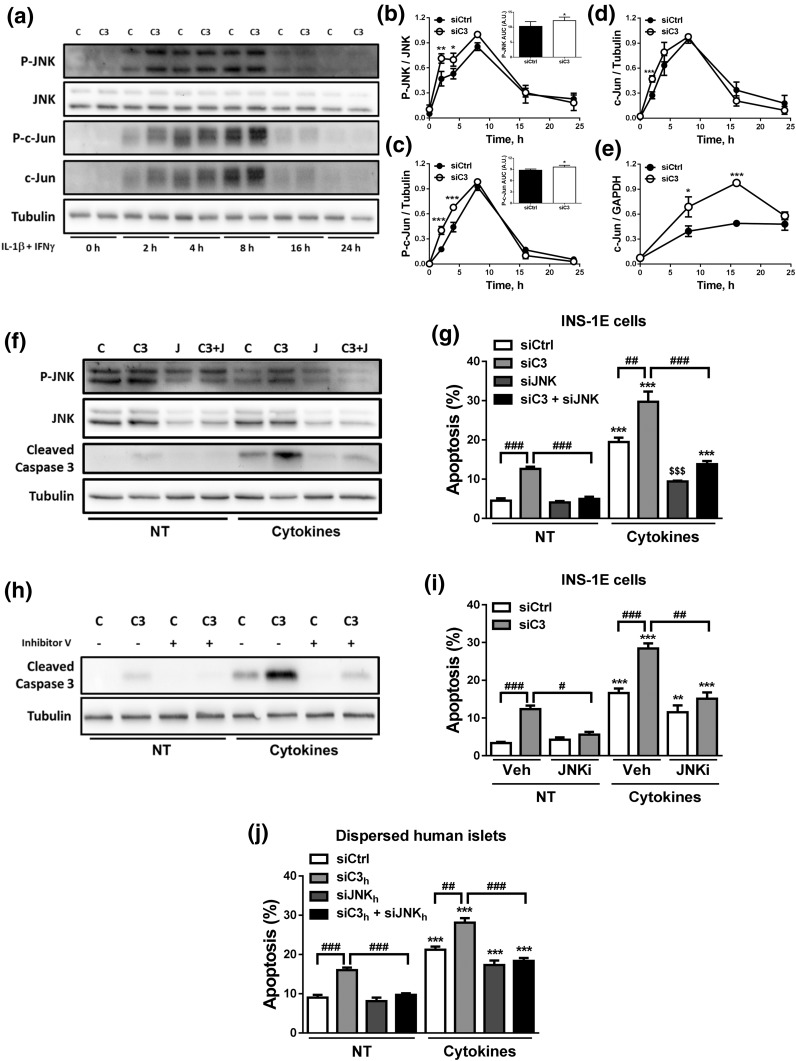
Figure 7.
C3 inhibition activates the JNK pathway. (a–e) INS-1E cells were transfected with siCtrl (C) or siRNA targeting rat C3 (siC3 no. 1, C3). Cells were then left untreated or treated with IL-1β plus IFN-γ (10 and 100 U/mL, respectively) as indicated under the figure. (a–d) P-JNK, JNK, P–c-Jun, c-Jun, and α-tubulin were measured by western blot. (a) Images are representative of four independent experiments. (b–d) Densitometry analysis of the western blots for (b) P-JNK, (c) P–c-Jun, and (d) c-Jun. Quantification of the area under curve (AUC) of P-JNK and P–c-Jun are shown in the inset graphs in (b) and (c), respectively. (e) c-Jun mRNA expression was analyzed by real-time polymerase chain reaction (RT-PCR) and normalized by the housekeeping gene GAPDH. (f and g) INS-1E cells transfected with siCtrl (C) or siRNAs targeting rat C3 (siC3 no. 1, C3), JNK (J), or both (C3 + J). Cells were then left untreated (NT) or treated with IL-1β plus IFN-γ (10 and 100 U/mL, respectively) for 16 hours. (f) P-JNK, JNK, cleaved caspase-3, and α-tubulin were measured by western blot. Images are representative of four independent experiments. (g) Apoptosis was evaluated using HO and PI staining in INS-1E cells. (h and i) INS-1E cells were transfected with siCtrl (C) or siRNA targeting rat C3 (siC3 no. 1, C3). Cells were then left untreated (NT) or treated with IL-1β plus IFN-γ in the absence or presence of JNK inhibitor V (JNKi). (h) Cleaved caspase-3 and α-tubulin were measured by western blot. Images are representative of four independent experiments. (i) Apoptosis was evaluated using HO and PI staining in INS-1E. (j) Apoptosis was evaluated using HO and PI staining in dispersed human islets transfected with siCtrl, siC3 no. 2h, siJNKh, or siC3 no. 2h + siJNKh and exposed for 48 hours to cytokines. Results are means ± SEM of three to five independent experiments. *P ≤ 0.05, **P ≤ 0.01, and ***P < 0.001 vs transfected with (b–e) siCtrl vs (g, i, and j) nontreated with cytokines (NT) and transfected with the same siRNA; #P < 0.05, ##P < 0.01, and ###P < 0.001 as indicated by bars; ANOVA followed by Student t test with Bonferroni correction.

