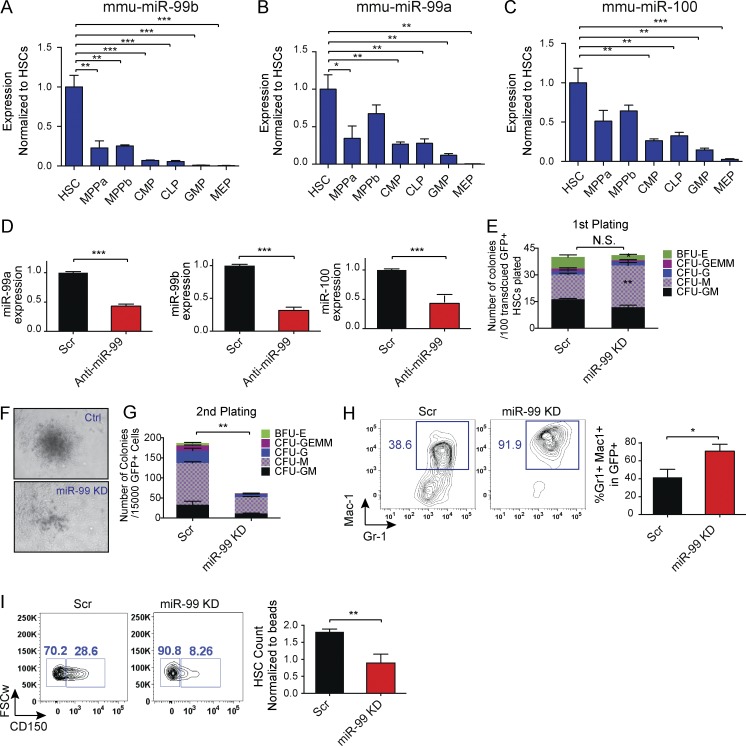
Figure 1.
miR-99 is highly expressed in hematopoietic stem and progenitors and suppresses myeloid differentiation in vitro. (A–C) Normalized expression levels of miR-99b, miR-99a, and miR-100 as determined by quantitative RT-PCR using miRNA TaqMan probes in mouse hematopoietic cell populations: hematopoietic stem cell (HSC), multipotent progenitor (MPP) Flk−, MPP Flk+, common lymphoid progenitor (CLP), common myeloid progenitor (CMP), granulocyte-macrophage progenitor (GMP), and megakaryocyte-erythroid progenitor (MEP) cells. Expression was normalized against mmu-mir-16. Error bars denote SEM. Representative data from five independent experiments are shown. (D) miR-99 is down-regulated 48 h post-transduction of HSCs with the lentiviral anti–miR-99 vector as shown by quantitative RT-PCR. Expression was normalized against U6 (Student’s t test; n = 3). Representative data from two independent experiments are shown. (E) Comparable number of colonies form after miR-99 KD in first plating, with an increase in the number of CFU macrophage (CFU-M) colonies. 100 GFP+ HSC cells were cultured in methylcellulose. The colonies were scored after 7 d. Data represent mean percentage ± SEM (Student’s t test; n = 3) and are representative of three independent experiments. (F) Smaller colonies were observed after second plating of GFP+ cells derived from miR-99 KD HSCs. Representative data of three independent experiments are shown. (G) Colony-forming capacity of HSCs is reduced after miR-99 KD in a second plating. 15,000 GFP+ cells were replated 7 d after the first plating. Colony types were scored after 7 to 10 d. Data represent mean count ± SEM (Student’s t test; n = 3) and are representative of three independent experiments. (H) miR-99 KD in HSCs induces granulocytic differentiation in methylcellulose colony assays. 7 d after plating, colonies were analyzed for expression of myeloid differentiation markers by flow cytometry. Mean percentage ± SEM (Student’s t test; n = 2). Representative data of three independent experiments are shown. (I) Flow cytometry analysis of LSK cells transduced with anti–miR-99 or Scr vectors and maintained in liquid culture for 8 d reveals a decrease in the absolute number of GFP+Lin−Sca-1+c-Kit+CD150+ HSCs. FSCw denotes forward scatter-width. The data shown are gated on LSK cells. Data represent mean count ± SEM (Student’s t test; n = 3) and are representative of two independent experiments. *, P < 0.05; **, P < 0.01; ***, P < 0.001.

