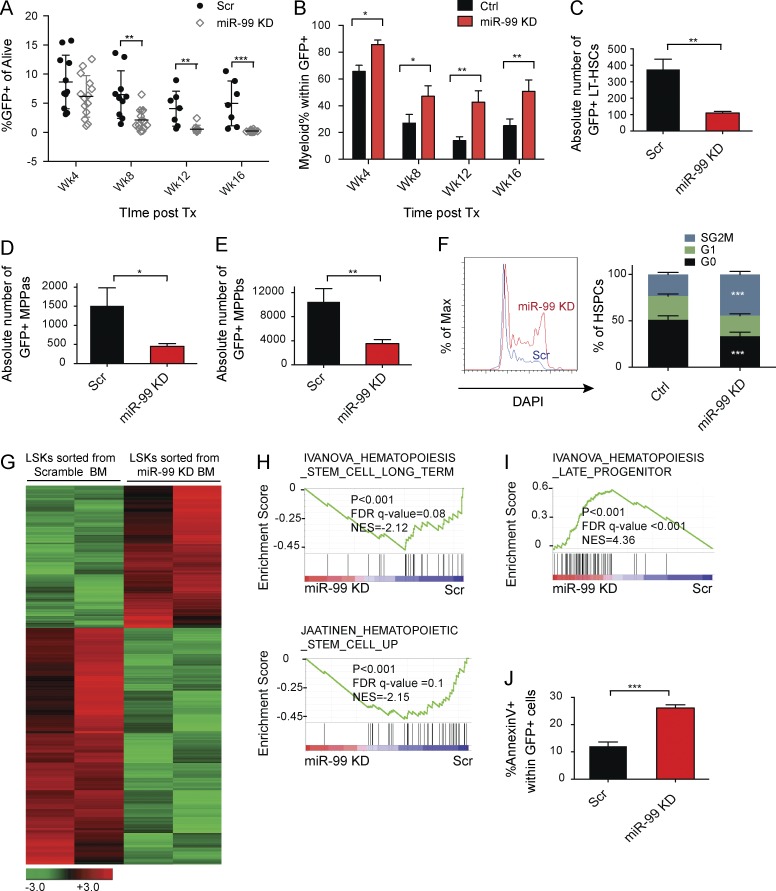
Figure 2.
miR-99 inhibition impairs HSC reconstitution capacity in vivo by inducing differentiation and increased cell cycling. (A) GFP+ chimerism of mice transplanted with miR-99 KD HSCs. HSCs were transduced with anti–miR-99 or scramble (Scr) control vectors, and 48 h later, 5,000 GFP+ cells were transplanted into lethally irradiated recipients along with 300,000 cells from Sca-1–depleted helper BM. Peripheral blood GFP chimerism was analyzed every 4 wk. Data represent mean percentages ± SEM (Student’s t test; n = 11 for Scr and n = 13 for miR-99 KD mice) and are representative of two independent experiments. Post tx, post-transplantation. (B) Flow cytometry analysis of the peripheral blood every 4 wk after transplantation of HSCs transduced with anti–miR-99 or Scr vectors. Data represent mean percentages ± SEM (Student’s t test; n = 11 for Scr and n = 13 for miR-99 KD mice) and are representative of two independent experiments. (C–E) Absolute number of GFP+Lin−c-Kit+Sca-1+CD48−CD150+ HSCs (C), CD48+CD150+ MPPa’s (multipotent progenitors a; (D), and CD48+ CD150neg MPPb's (multipotent progenitors b; E) in bilateral long bones and hips 16 wk post-transplant of HSCs. Data represent mean count ± SEM (Student’s t test; n = 4) and are representative of two independent experiments. (F) Ki-67/DAPI staining of donor-derived GFP+Lin−c-Kit+ HSPCs 6 mo post-transplant of miR-99 KD or Scr HSCs. Data represent mean percentage ± SEM (Student’s t test; n = 7 for Scr and n = 8 for miR-99 KD) and are representative of two independent experiments. (G) RNA-seq analysis of LSK cells FACS sorted from BM of mice transplanted with miR-99 KD or scramble control HSCs 3 mo after transplant (n = 2). (H and I) Gene set enrichment analysis for differentially expressed genes in stably engrafted miR-99 KD versus Scr LSK cells. FDR, false discovery rate; NES, normalized enrichment score. (J) Annexin V staining of total GFP+ cells in the BM 6 mo post-transplant. Data represent mean percentage ± SEM (Student’s t test; n = 7 for Scr and n = 8 for miR-99 KD) and are representative of two independent experiments. *, P < 0.05; **, P < 0.01; ***, P < 0.001.

