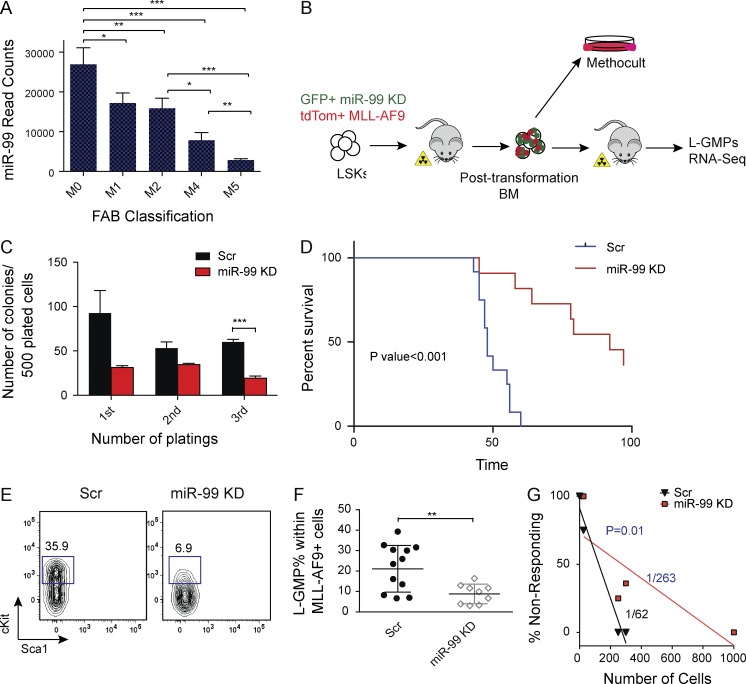
Figure 3.
miR-99 KD improves survival in an MLL-AF9 model of leukemia by depleting leukemia stem cells. (A) miRNA-sequencing data from 153 AML patients in the TCGA database. Sum of read counts of all miR-99 family members (miR-99a, miR-99b, and miR-100) is graphed as a function of the French–American–British (FAB) classification. (B) Schematic for miR-99 KD experiments in the MLL-AF9 mouse model of AML. LSK cells were cotransduced with GFP+ miR-99 KD and tdTom+ MLL-AF9 overexpressing vectors, and GFP+ tdTom+ cells were transplanted into sublethally irradiated mice. BM from transplanted animals was used for secondary transplants and methylcellulose replating assays. (C) Methylcellulose colony plating assay of post-transformed BM from primary AML recipients with miR-99 KD. 500 GFP+ tdTom+ cells were plated into methylcellulose media and replated every 7 d. Data represent mean count ± SEM (Student’s t test; n = 3) and are representative of two independent experiments. (D) Kaplan–Meier curves of recipients of secondary leukemia transplants. 300 GFP+ tdTom+ leukemic BM cells from primary recipients were transplanted into sublethally irradiated C57BL/6 recipients (Mantel–Cox test; n = 12 for Scr and n = 11 for miR-99 KD). Representative data from four independent experiments are shown. (E and F) Flow cytometry analysis of L-GMPs from the BM of secondary recipients. Gates were drawn on the GFP+ tdTom+ CD16/32+ population. Mean percentage ± SEM (Student’s t test; n = 12 for Scr and n = 9 for miR-99 KD). Representative data from four independent experiments are shown. (G) GFP+ tdTom+ cells were FACS sorted from the BM of primary recipients and transplanted in limiting dilutions into secondary recipients. Limiting dilution analysis was performed using ELDA software. See also Fig. S3 D. Representative data two independent experiments are shown. *, P < 0.05; **, P < 0.01; ***, P < 0.001.

