Figure 6.
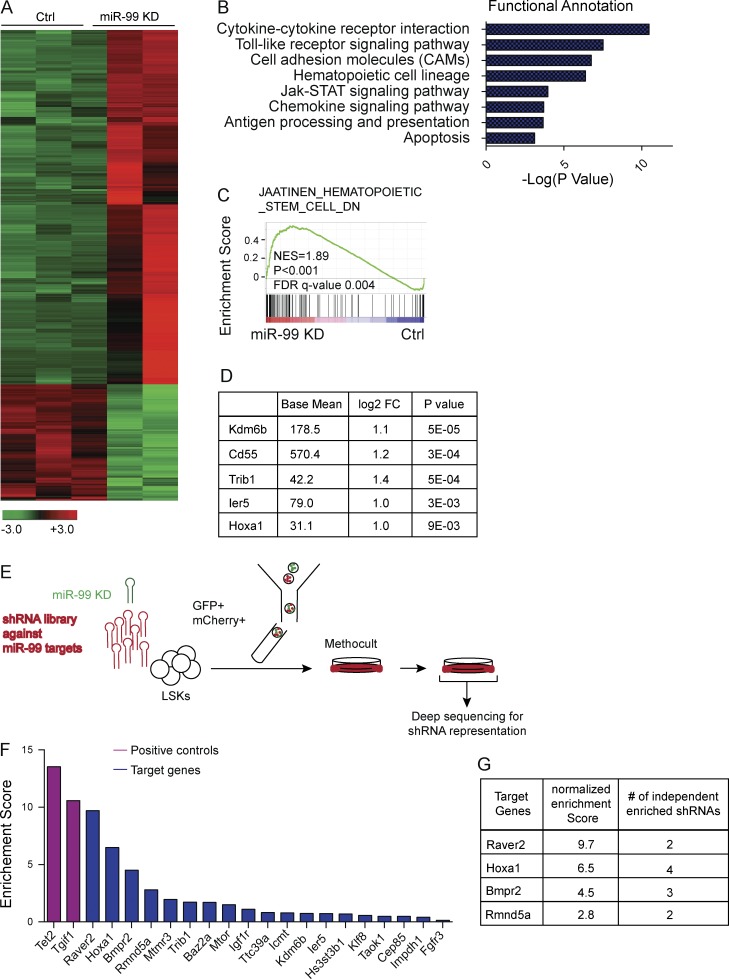
Forward genetic screen identifies miR-99 target genes. (A) Heat map shows genes differentially expressed between scramble control and miR-99 KD LSK cells. RNA-Seq was performed on LSK cells 48 h after transduction with miR-99 KD or scramble control lentivirus. Infected cells were FACS sorted based on GFP expression (n = 3 for control and n = 2 for miR-99 KD). (B) Functional annotation of genes up-regulated in LSK cells after miR-99 KD using the database for annotation, visualization, and integrated discovery (DAVID). The top functional groups are depicted as a function of −log (p-value). (C) GSEA of the differentially expressed genes in LSK cells after miR-99 KD reveals induction of a differentiation gene signature. The gene set denotes genes down-regulated in CD133+ cells (hematopoietic stem cells [HSCs]) compared with CD133− cells. (D) Top up-regulated miR-99 target genes identified from RNA-seq experiments in LSK cells transduced with miR-99 KD or scramble control vectors. FC, fold change. (E) Schematic representation of the shRNA library screen experiment designed to identify miR-99 target genes that rescue the hematopoietic phenotype induced by miR-99 KD. LSK cells were cotransduced with lentiviral anti–miR-99 and the retroviral shRNA library. 48 h later, the resulting GFP+mCherry+ cells were FACS sorted into complete methylcellulose and allowed to form colonies. 10 d later, colonies were resuspended, and cells were replated a second time and cultured for an additional 7 d. gDNA from the resulting GFP+ mCherry+ cells was deep sequenced to identify integrated shRNAs. Representative data from three independent experiments are shown. (F) Pooled shRNA library screen identifies genes that are positively selected in LSKs transduced with anti–miR-99 KD. The y axis depicts normalized enrichment scores, which is defined as the enrichment score for each shRNA divided by its enrichment score at T0, calculated as the mean of three independent experiments, and shown in descending order. The x axis denotes genes from the screen that are predicted to be targeted by miR-99 both in mouse and human. Positive controls included shRNAs targeting Tet2 and Tgif1. Average data from three independent experiments are shown. (G) Normalized enrichments scores and the number of independent enriched shRNAs for each gene, depicted for the top genes identified in the shRNA screen. Average data from three independent experiments are shown.

