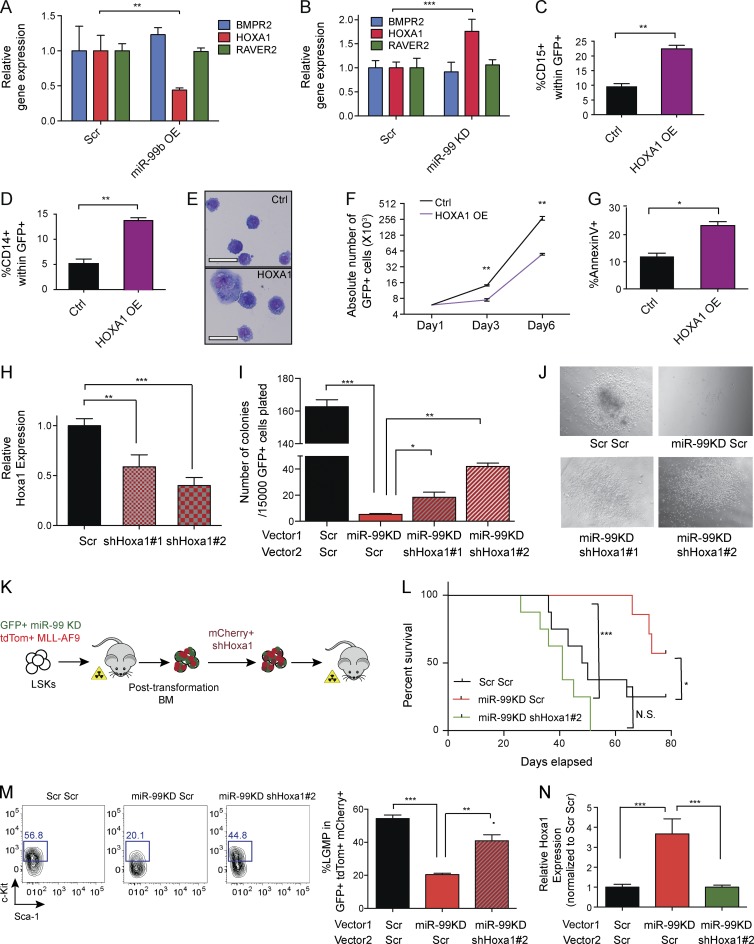
Figure 7.
HOXA1 mediates miR-99 function in normal and malignant hematopoiesis. (A) TaqMan quantitative RT-PCR for HOXA1, BMPR2, and RAVER2 expression upon miR-99 overexpression in MonoMac6 AML cells 48 h post-transduction. Expression was normalized to ACTB (Student’s t test; n = 3). Representative data from two independent experiments are shown. (B) TaqMan quantitative RT-PCR for HOXA1, BMPR2, and RAVER2 expression upon miR-99 KD in MonoMac6 AML cells 48 h post-transduction. Expression was normalized to ACTB (Student’s t test; n = 3). Representative data from two independent experiments are shown. (C and D) Flow cytometry analysis of MonoMac6 cells 4 d after transduction with HOXA1-overexpressing virus. miR-99 KD induces the myeloid differentiation markers CD15 (C) and CD14 (D). Data represent mean percentage ± SEM (Student’s t test; n = 3) and are representative of two independent experiments. (E) Wright–Giemsa staining of MonoMac6 cells 4 d post-transduction with miR-99 KD (bars, 25 µm). (F) Growth curve for MonoMac6 cells as a function of time after transduction. Data represent mean count ± SEM (Student’s t test; n = 3) and are representative of two independent experiments. (G) Representative flow cytometry graph and the corresponding diagram depicting Annexin V apoptosis assay with HOXA1 overexpression in MonoMac6 cells. Data represent mean percentage ± SEM (Student’s t test; n = 3) and are representative of two independent experiments. (H) TaqMan quantitative RT-PCR for Hoxa1 expression 48 h after shHoxa1 transduction of LSK cells. Expression was normalized to Actb (Student’s t test; n = 3). Representative data from two independent experiments are shown. (I) Hoxa1 KD partially rescues colonies reduced upon miR-99 KD. LSK cells were infected with anti–miR-99 (GFP+) and shHoxa1 (mCherry+) viruses. 2 d post-transduction, the resulting GFP+ mCherry+ cells were sorted into Methocult M3434 and replated after 7 d. Shown are the results from secondary colonies, which were scored 10 d after plating. Data represent mean count ± SEM (Student’s t test; n = 3) and are representative data of two independent experiments. (J) Simultaneous KD of Hoxa1 in miR-99 KD LSKs increases the size of miR-99 KD colonies. Shown are representative colonies from secondary platings. (K) Schematic for Hoxa1 KD LSC rescue experiments. miR-99 KD MLL-AF9 (GFP+ tdTom+) BM blasts from primary recipients were transduced with shHoxa1 (mCherry+), and the resulting GFP+ tdtom+ mCherry+ cells were transplanted into sublethally irradiated mice. (L) Kaplan–Meier curves of mice transplanted with MLL-AF9 blasts. 100,000 BM blasts from primary recipients of the indicated genotypes were transplanted into sublethally irradiated secondary recipients (Mantel–Cox test; n = 8 per condition). Representative data from two independent experiments are shown. (M) Flow cytometry analysis of L-GMPs from the BM of secondary recipients. Cells were pregated on GFP+ tdTom+ mCherry+ CD16/32+ cells. Data represent mean percentage ± SEM (Student’s t test; n = 3 for Scr and shHoxa1#1 and n = 4 for miR-99 KD and shHoxa1#2) and are representative of two independent experiments. (N) TaqMan quantitative RT-PCR for Hoxa1 expression in L-GMPs sorted from secondary recipients at the time of death. Expression was normalized to Actb. Data represent mean ± SEM (Student’s t test; n = 3) and are representative of two independent experiments. *, P < 0.05; **, P < 0.01; ***, P < 0.001.

