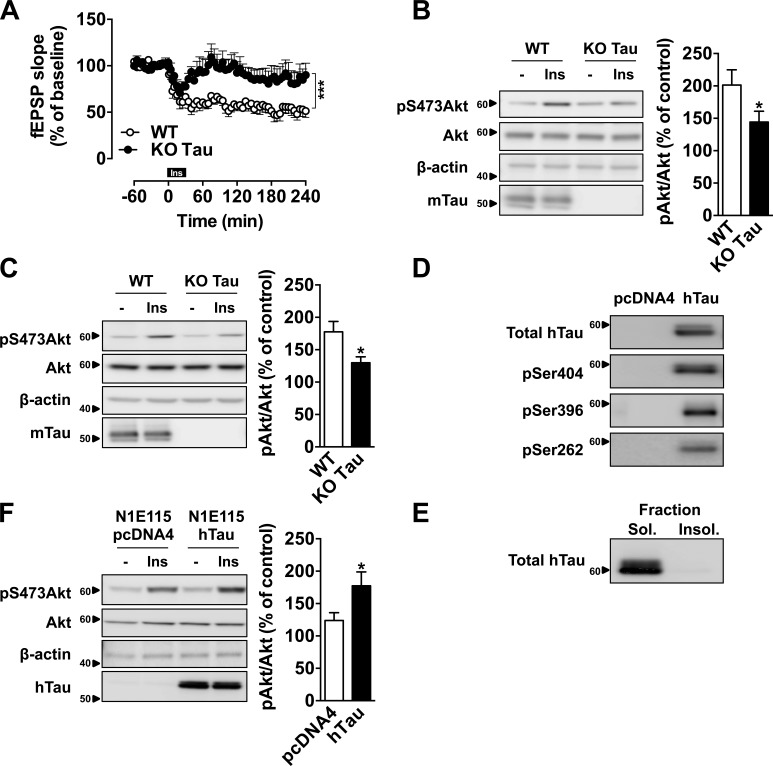
Figure 1.
Tau regulates hippocampal response to insulin. (A) Hippocampal LTD induced by 1 µM insulin (30 min) in tau KO and WT mice. Each point represents mean ± SEM normalized to baseline values preceding the application of insulin (***, P < 0.001, two-way ANOVA). (B) Akt phosphorylation in hippocampal slices from tau KO mice and littermate controls, 10 min after 200 nM insulin treatment (*, P < 0.05, Student’s t test). (C) Akt phosphorylation in the hippocampus of tau KO mice and littermate controls, 1h after an icv injection of 2 µl at 5 mg/ml insulin (*, P < 0.05, Student’s t test). Tau KO mice were 7–12 mo old. (D) hTau expression and phosphorylation and (E) hTau detection in sarkosyl-soluble and -insoluble fractions from N1E115 cells overexpressing WT 1N4R human tau isoform. (F) Akt phosphorylation in N1E115 overexpressing WT hTau or transfected by empty vector, 10 min after insulin treatment at 200 nM (*, P < 0.05, Student’s t test). Controls are indicated as open circles/bars and tau KO/overexpressing cells as black circles/bars. Data in A–C show mean ± SEM from six (A), six to eight (B), and six or seven (C) mice per group from six (A), two (B), or three (C) independent experiments. Data in D and E show results from one independent experiment. Data in F show mean ± SEM from eight wells per group from five independent experiments. Ins, insulin. Molecular mass is indicated in kilodaltons.

