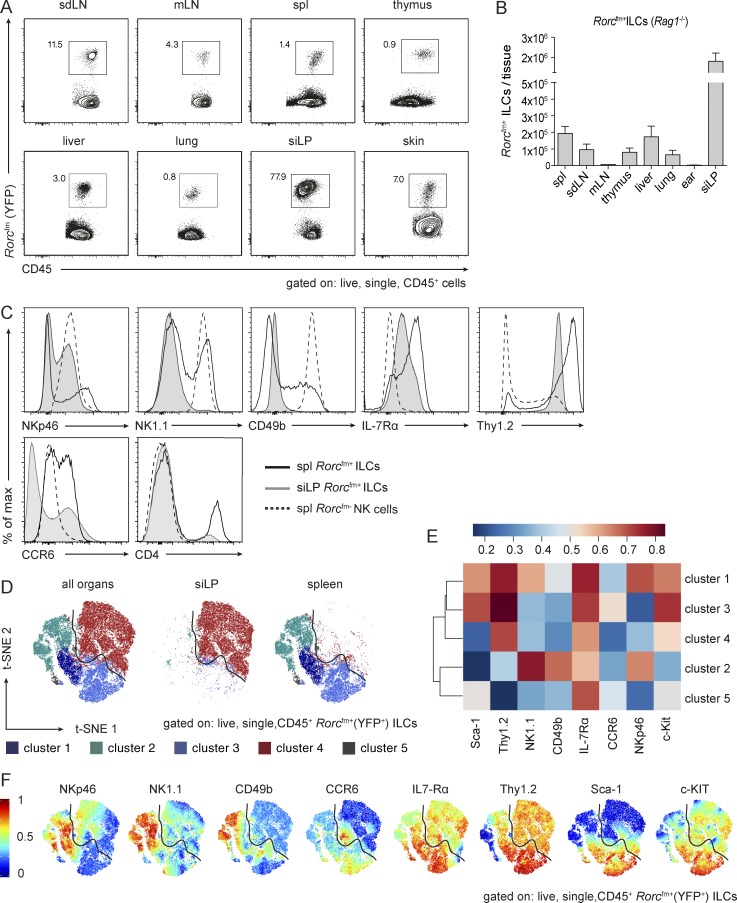
Figure 1.
ILCs reside in various tissues and Rorcfm+ ILCs from spleen and small intestine cluster in demarcated cluster sets. (A) Flow cytometric analysis to identify Rorcfm+ ILCs in various organs of Rorcfm-Rag1−/− mice, including lymphoid organs, such as skin-draining LNs (sdLN), mesenteric LNs (mLN), spleen (spl), and thymus as well as nonlymphoid organs, such as the liver, lung, siLP, and skin in a steady state. Representative graphs of two independent experiments, n ≥ 4 each. (B) Total counts of Rorcfm+ ILCs within the CD45 compartment of various organs of Rorcfm-Rag1−/− mice (skin represents total counts of two ears). Graphs represent pooled data from two independent experiments, n ≥ 4 each (means ± SEM). (C) Histogram overlay of splenic (spl) Rorcfm+ ILCs (black continuous line), siLP Rorcfm+ ILCs (gray continuous line), and splenic (spl) Rorcfm- NK cells (dotted line). Representative histograms of four independent experiments, n ≥ 5 each. (D) Dimensionality reduction using t-SNE. Data from 4 × 10⁴ Rorcfm+ ILCs of spleen and siLP (gated on live, single CD45+Rorcfm+ ILCs) were transformed and plotted in two t-SNE dimensions using R software. Clustering was performed using the flowSOM algorithm (k = 5). Depicted are the combined spleen and siLP data sets (left), the siLP data set only (middle), and the spleen data set only (right). (E) ILC3-associated and NK cell–associated markers plotted in a heat map across flowSOM clusters from D. (F) Expression pattern of ILC3-associated and NK cell–associated markers depicted in the two t-SNE dimensions.

