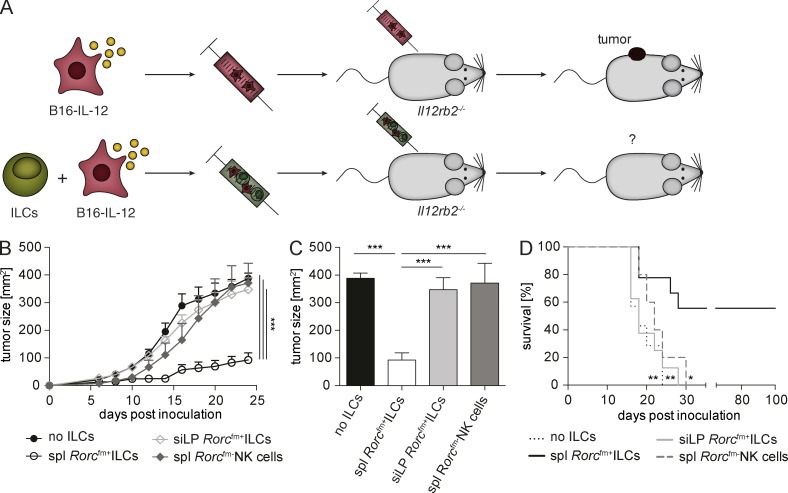
Figure 3.
Splenic Rorcfm+ ILCs suppress tumor growth in an IL-12–dependent manner. (A) Schematic representation of the experimental setup. B16–IL-12 tumor cells were s.c. injected into Il12rb2−/− mice with or without Rorcfm+ ILCs, isolated from various organs of Rorcfm-Rag1−/− mice using flow cytometric cell sorting. (B) Tumor growth of B16–IL-12 tumor cells coinjected with splenic (spl) Rorcfm+ ILCs (open circles), siLP Rorcfm+ ILCs (open squares), or splenic (spl) Rorcfm-NK cells (closed squares), respectively, or in the absence of ILCs (closed circles) over time. For comparison of the tumor growth curve two-way ANOVA with Tukey’s multiple comparisons test was used. ***, P < 0.001. (C) Quantification of tumor growth at d 24 after tumor inoculation. One-way ANOVA with Tukey’s multiple comparisons test was performed. ***, P < 0.001. (D) Kaplan-Meier survival curve of mice coinjected with B16–IL-12 and splenic (spl) Rorcfm+ ILCs (bold continuous line), siLP Rorcfm+ ILCs (gray continuous line), splenic (spl) Rorcfm- NK cells (gray dashed line), or in the absence of ILCs (bold dotted line). (B–D). Graphs represent pooled data from three independent experiments, n ≥ 4 each (means ± SEM). For comparison of survival curves, a Lox-rank (Mantel-Cox) test was used. *, P < 0.05; **, P < 0.01; ***, P < 0.001.

