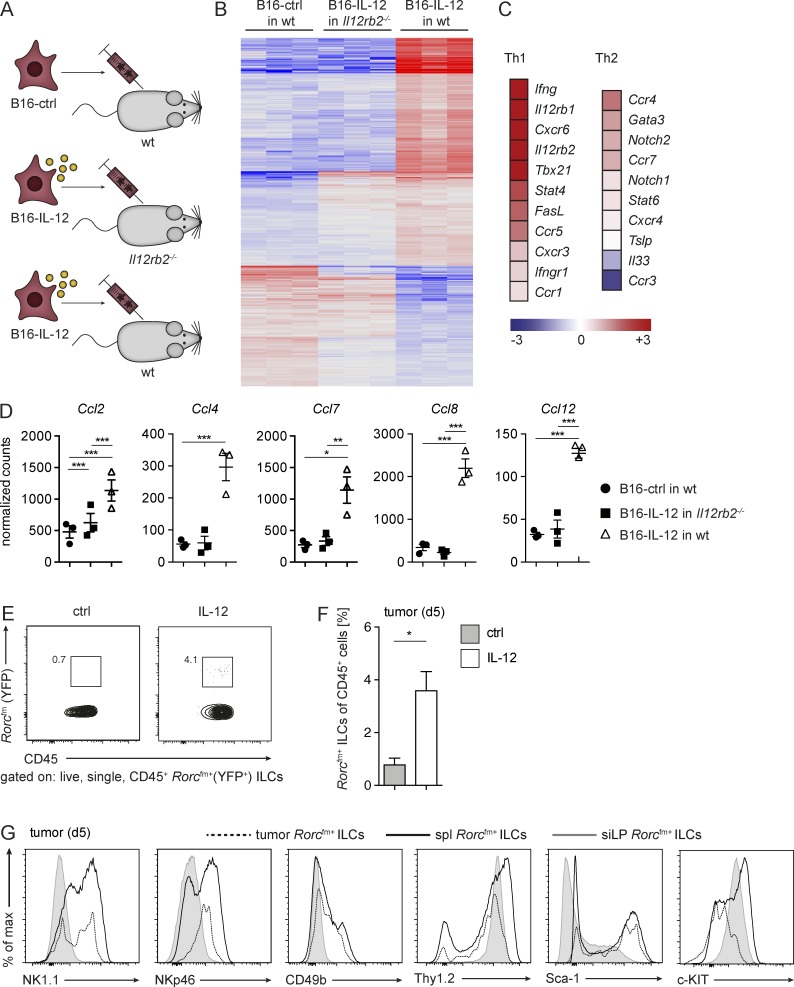
Figure 5.
IL-12 alters the tumor microenvironment and increases the frequency of tumor-infiltrating Rorcfm+ ILCs. (A) Schematic representation of the three experimental groups used for NGS: B16-control (ctrl) tumor cells were injected into WT mice and B16-IL-12 tumor cells into WT or Il12rb2−/− mice, respectively. NGS was performed on RNA obtained from tumors 5 d after tumor inoculation. (B) Heat map of differentially expressed genes in the tumor tissue. (C) Heat map of expression levels of Th1- and Th2-associated genes of B16–IL-12 in WT mice (means of three tumors depicted). (D) Normalized counts of the chemokines Ccl2, Ccl4, Ccl7, Ccl8, and Ccl12. Each data point represents one tumor (means ± SEM). One-way ANOVA with Tukey’s multiple comparisons test was performed. *, P < 0.05; **, P < 0.01; ***, P < 0.001. (E) Flow cytometric analysis of live, single CD45+ Rorcfm+ ILCs in the tumor tissue (growing in Rorcfm-Rag1−/− mice) 5 d after tumor inoculation. (F) Frequencies of tumor-infiltrating Rorcfm+ ILCs within the CD45 compartment 5 d after tumor inoculation in the presence or absence of intratumorally administered IL-12. Representative graph of one of three independent experiments, n ≥ 3 each (means ± SEM). Two-tailed, unpaired t test was used. *, P < 0.05. (G) Histogram overlay of Rorcfm+ ILCs of tumor (dotted line), spleen (spl, bold continuous line), and siLP (gray continuous line) 5 d after tumor inoculation into Rorcfm-Rag1−/− mice. Representative histograms from three independent experiments, n = 5 each.

