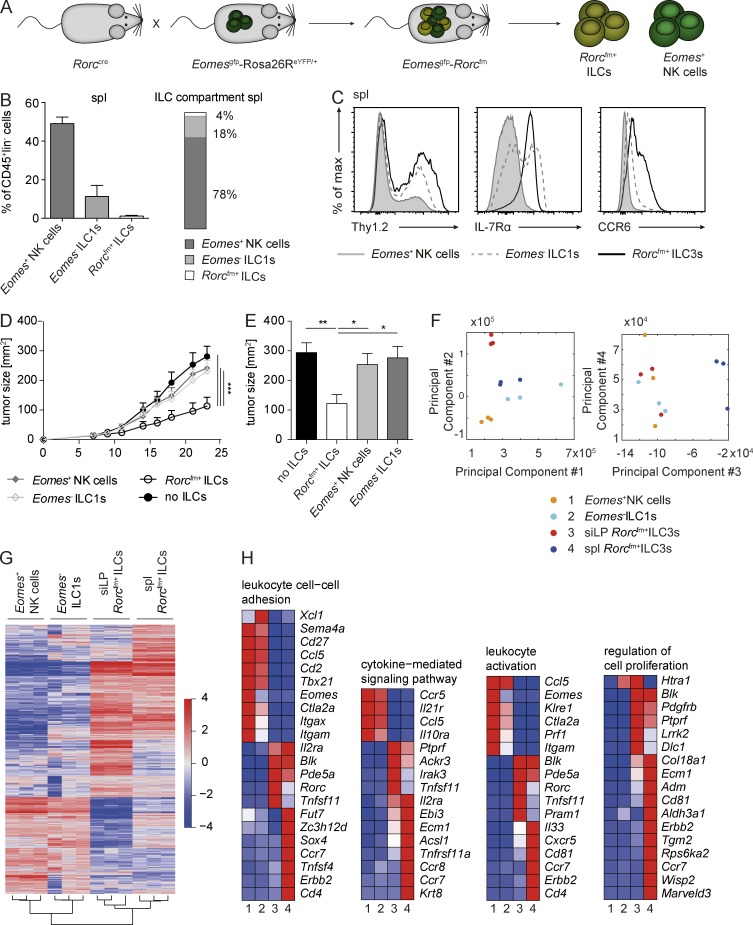
Figure 6.
ILC1s phenotypically resemble tumor-suppressive Rorcfm+ ILCs but fail to inhibit tumor growth. (A) Schematic representation of the Rorccre mice crossed to the EomesGFP-Rosa26ReYFP/+ mice labeling all cells expressing RORγt with enhance YFP and all cells expressing Eomes with GFP. (B, left) Quantification of the different ILC subsets within the CD45+ compartment of the spleen. (Right) Distribution of NK cells (dark bar), ILC1s (light bar), and ILC3s (white bar) within the ILC compartment of the spleen. Graphs represent pooled data from two independent experiments, n ≥ 5 each (means ± SEM). (C) Histogram overlay of different ILC subsets in the spleen. Representative histograms of two independent experiments, n ≥ 5 each. (D) Il12rb2−/− mice were s.c. challenged with B16–IL-12 coinjected with splenic (spl) Rorcfm+ ILCs (open circles), Eomes− ILC1s (open squares), Eomes+ NK cells (closed squares), or in the absence of ILCs (closed circles), and tumor growth was measured over time. Graphs represent pooled data from two independent experiments, n ≥ 5 each (means ± SEM). For comparison of the tumor growth curve, two-way ANOVA with Tukey’s multiple comparisons test was used. ***, P < 0.001. (E) Quantification of tumor burden 21 d after tumor inoculation. Graphs represent pooled data from two independent experiments, n ≥ 5 each (means ± SEM). One-way ANOVA with Tukey’s multiple comparisons test was performed. *, P < 0.05; **, P < 0.01. (F) PCA of different ILC subsets, including splenic NK cells, ILC1s, and Rorcfm+ ILC3s as well as siLP Rorcfm+ ILC3s. (G) Heat map of differentially expressed genes of splenic NK cells, ILC1s and (Rorcfm+) ILC3s as well as siLP (Rorcfm+) ILC3s. (H) Heat maps of differentially expressed genes clustered to the indicated category. Heat maps show representative data of one sample per group.

