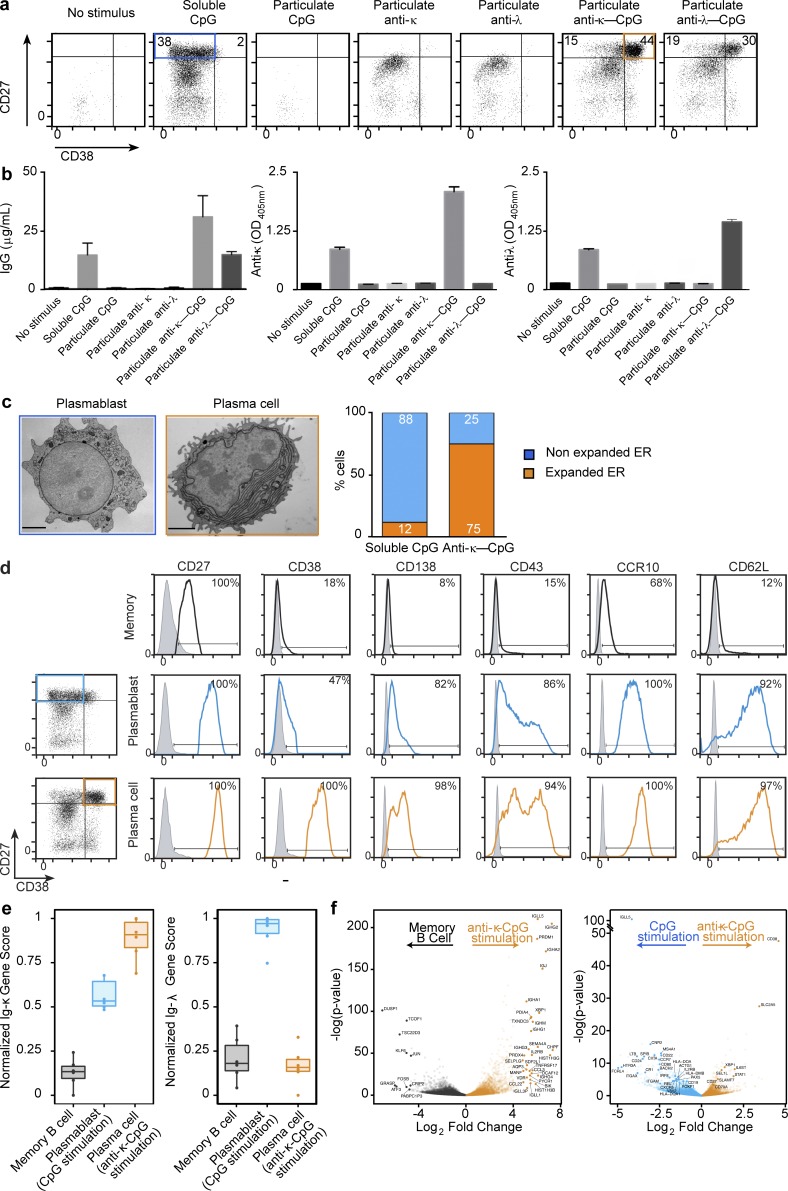
Figure 2.
Uptake of particulate anti–BCR-CpG is essential for promoting CD27hi/CD38hi plasma cell differentiation. (a) Flow cytometry profiles of CellTrace Violet–labeled memory B cells unstimulated or cultured for 6 d in the presence of soluble GpG, particulate CpG, particulate anti-BCR, or particulate anti–BCR-CpG. Numbers in the plots indicate the percentage of plasmablasts (blue) and plasma cells (orange) based on the expression of CD27/CD38 in proliferating cells. One representative result of six independent experiments is shown. (b) The concentration of IgG antibodies secreted in the culture supernatant and the presence of κ- or λ-chain antibodies was determined by ELISA. Left, mean ± SD IgG concentrations from three different donors. Middle and right, results of ELISA assays to detect κ- and λ-Igs, respectively. Results represent the mean OD405 values ± SD of two replicates; one representative result of three independent experiments is shown. (c) Representative TEM images of CD27hi/CD38int plasmablasts and CD27hi/CD38hi plasma cells of six independent experiments. Bars, 2 µm. Percentage of cells with expanded and nonexpanded ER is shown in the chart to the right (n = 100). (d) Comparison of the surface phenotype of the CD27hi/CD38int (blue) and CD27hi/CD38hi (orange) cell populations after particulate anti–κ-CpG stimulation. As a control, the phenotype of the memory B cells before stimulation is also shown. Flow cytometry data from one representative experiment of four independent experiments is shown. In each plot, gray traces represent the corresponding isotype control. Numbers in panels indicate the percentage of cells positive for the indicated markers. (e) Specific activation of memory B cells by anti–κ-CpG leads to the acquisition of a plasma cell phenotype revealed by RNA-seq analysis, performed on mRNA isolated from memory B cells that were unstimulated or stimulated with CpG or anti–κ-CpG. Transcriptional profiles of each B cell population were scored against Ig-κ and Ig-λ variable and constant region genes. Box and whiskers represent the upper and lower quartile of scores and 1.5 × the inner quartile range, respectively. (f) Significance plotted against log2 fold change for differentially expressed genes as determined by DESeq2 analysis between B cells stimulated with anti–κ-CpG and unstimulated B cells and between B cells stimulated with anti–κ-CpG and CpG. For this experiment, data are derived from PBMCs obtained from six independent donors.

