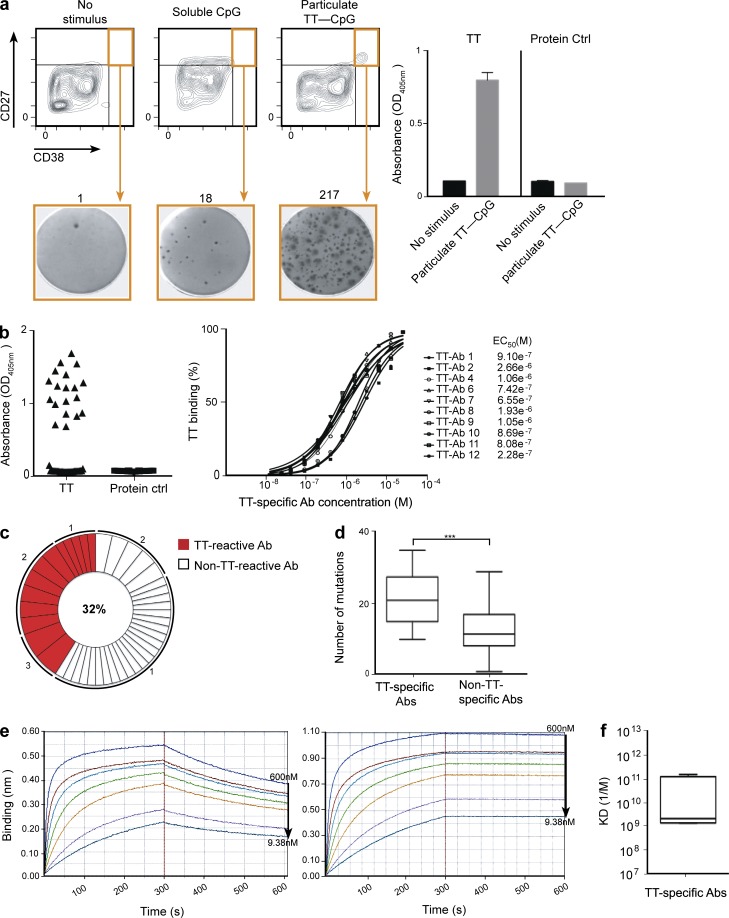
Figure 3.
Generation of human TT-specific antibodies from sorted plasma cells. (a) Representative FACS profile and gating strategy for sorting plasma cells (orange box) after no stimulation or stimulation with soluble CpG or particulate TT-CpG. Enrichment of TT-specific plasma cells after sorting was determined by ELISPOT and ELISA. One representative ELISPOT of three shows IgG-producing plasma cells that are reactive against TT. The numbers above the ELISPOT panels represent the spot count for that well. Culture supernatants from sorted plasma cells were tested by ELISA (right) for the presence of antibodies specific for TT or to an unrelated protein control. Data represent the mean OD405 values ± SD from two replicates. Data from one representative experiment of three independent repeats is shown. (b) The specificity of the recombinant antibodies generated from 56 single-sorted plasma cells was tested by ELISA. Cognate IgH and IgL gene pairs were transiently transfected into HEK293T cells, and the culture supernatant was tested for the presence of antibodies specific for TT or an unrelated protein control (left); the mean IgG antibody concentration was 1 µg/ml. The cutoff value for a positive signal was set as more than twofold above background. The EC50 values of the transfected TT-specific antibodies were extracted from the fitting of the raw data to a sigmoidal multiparameter curve (right). (c) Pie chart outlines the frequency of the TT-specific clones. The percentage of TT-positive antibodies is denoted in the center of the pie chart. The numbers outside the pie chart indicate the number of antibody allele sequences with identical IgH and IgL chain rearrangements. (d) Comparison of the absolute numbers of somatic mutations in the VH genes encoding 13 TT-specific and 24 non–TT-specific antibodies. Boxes represent the percentile range (25–75%), the horizontal bar indicates the median, and whiskers extend to the highest and lowest data points. Two-tailed P values were calculated with an unpaired t test (***, P = 0.0005). (e) Representative Octet measurements of the kinetics of TT-specific antibodies (left, Kd = 6.64 × 10⁻⁹; right, Kd = 1.85 × 10⁻¹¹). Concentrations of the antibodies represent serial twofold dilutions. (f) Kd of TT-specific antibodies. Boxes represent the percentile range (25–75%), the horizontal bar indicates the median KD value (1.6 nM) of six TT-specific antibodies, and whiskers extend to the highest and lowest data points.

