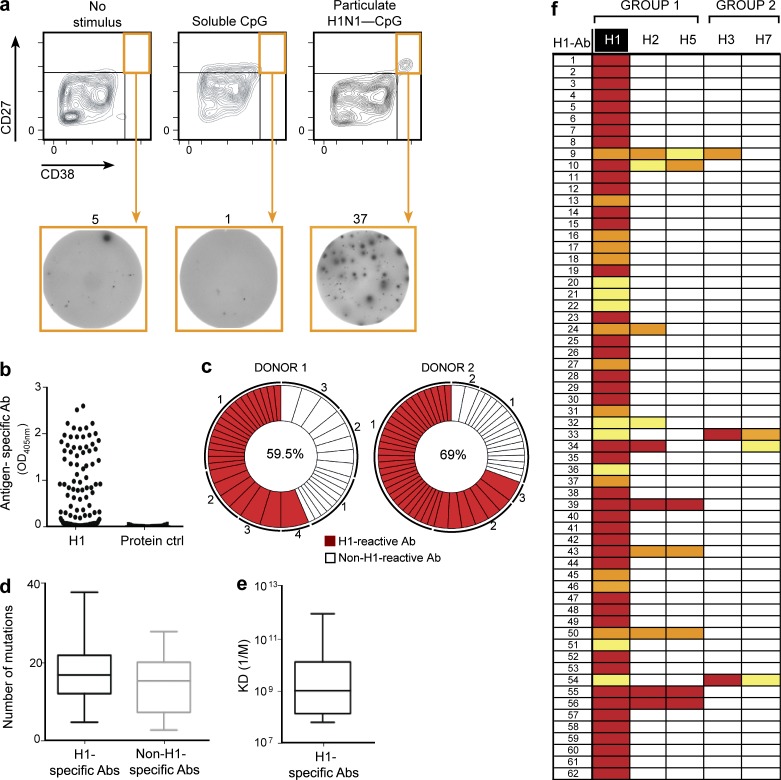
Figure 4.
Generation of human H1-specific antibodies from single-sorted plasma cells. (a) Representative FACS profile and gating strategy for sorted plasma cells (orange box) after stimulation with soluble CpG, particulate H1-CpG, or no stimulation. Enrichment of FACS-sorted H1-specific plasma cells detected by ELISPOT. Numbers above the ELISPOT panels represent the spot counts for each well. Data from one representative experiment of three is shown. (b) Specificity of the recombinant antibodies generated from sorted plasma cells from two donors was tested by ELISA. After transient transfection of HEK293T cells with plasmids expressing cognate pairs of IgH and IgL genes, the culture supernatant was tested for the presence of antibodies specific for H1 or an irrelevant protein control; the recombinant IgG antibody concentration ranged from 1 to 3 µg/ml. (c) The frequency of the H1-specific clones is depicted by the pie chart. The percentage of H1-positive antibodies retrieved from each donor is indicated in the center of the pie chart. The numbers outside the pie chart indicate the number of antibody allele sequences with identical IgH and IgL chain rearrangements. (d) Comparison of the absolute numbers of somatic mutations in the VH genes encoding 56 H1-specific and 34 non–H1-specific antibodies. Boxes represent the percentile range (25–75%), the horizontal bar indicates the median, and whiskers extend to the highest and lowest data points. Two-tailed P values were calculated with an unpaired t test (P = 0.0870; NS). (e) Affinity (Kd 1/M) of the H1-specific antibodies. Boxes represent the percentile range (25–75%), the horizontal bar indicates the median Kd value (7.34 nM) of 14 H1-specific antibodies, and whiskers extend to the highest and lowest data points. (f) ELISA test to detect cross-reactivity of antibodies derived after H1 stimulation. Strong binding is coded in red (>2.0 OD405), intermediate in orange (1.0–2.0 OD405), and weak in yellow (0.3–1.0 OD405).

