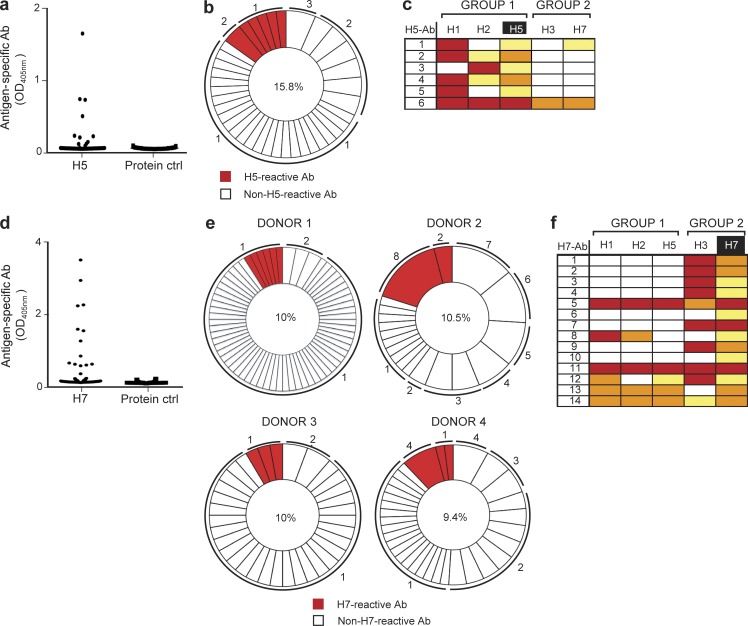
Figure 5.
Generation of human H5- and H7-specific antibodies from single sorted plasma cells. (a) The specificity of H5-specific recombinant antibodies generated from sorted plasma cells from one donor was tested by ELISA. Cognate pairs of IgH and IgL genes were introduced into HEK293T cells by transient cotransfection. Culture supernatants were tested by ELISA for the presence of antibodies specific for H5 or an irrelevant protein control; the mean IgG antibody concentration was 1 µg/ml. Cutoff value for a positive signal is taken as more than twofold above background. (b) Pie chart outlining the frequency of the H5-specific clones. The number in the center indicates the percentage of H5-positive antibodies. The numbers outside the pie chart indicate the number of antibody gene sequences with identical IgH and IgL chain rearrangements. (c) ELISA test to detect cross-reactivity of antibodies derived after H5 stimulation. Strong binding is coded in red (>2.0 OD405), intermediate in orange (1.0–2.0 OD405), and weak in yellow (0.3–1.0 OD405). (d) Specificity of the H7 recombinant antibodies retrieved from four donors. Culture supernatants from transfected HEK293T cells, with a mean IgG concentration of 1 µg/ml, were tested by ELISA for the presence of antibodies specific for H7 or to an irrelevant protein control. The cutoff considered for positive results was more than twofold background. (e) Frequency of H7-specific clones. The number in the center of the pie chart indicates the percentage of H7-positive antibodies. The numbers outside the pie chart indicate the number of antibody alleles with identical IgH and IgL chain rearrangements. (f) ELISA analysis to detect cross-reactivity of antibodies derived after H7 stimulation. Strong binding is coded in red (>2.0 OD405), intermediate in orange (1.0–2.0 OD405), and weak in yellow (0.3–1.0 OD405).

