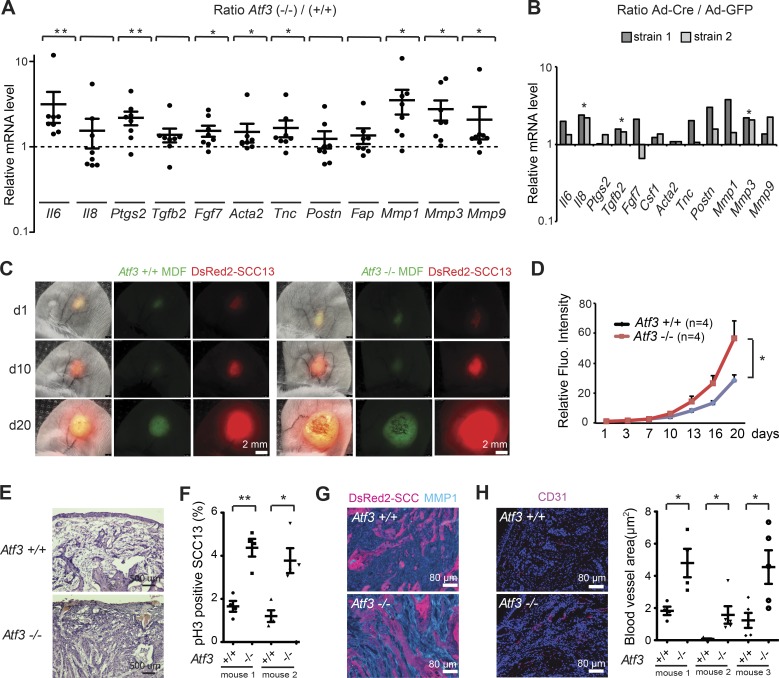
Figure 2.
Atf3 deletion in mouse dermal fibroblasts enhances tumorigenic behavior of keratinocyte-derived SCC. (A) RT-qPCR analysis of the indicated genes in multiple parallel cultures of primary dermal fibroblasts derived from either individual or pooled newborn Atf3−/− (n = 8) and Atf3+/+ (n = 5) mice. Values are expressed as log10 ratios in Atf3−/− versus Atf3+/+ cultures. Data are mean ± SEM, one-tailed one-sample t test, *, P < 0.05; **, P < 0.005. (B) RT-qPCR analysis of the indicated genes in two different preparations of primary dermal fibroblasts from Atf3loxP/loxP mice at 3 d after infection with a Cre-expressing adenovirus (Ad-Cre; n = 2) or GFP control (Ad-GFP; n = 2) for Atf3 gene deletion. In both experiments, Atf3 expression was reduced more than 40-fold in Ad-Cre–infected cells. Values are expressed as log10 ratios in cultures with and without Atf3 deletion. One-tailed, one-sample t test, *, P < 0.05. (C and D) Human SCC13 cells (DsRed) were admixed with mouse dermal fibroblasts (MDFs) with and without Atf3 deletion labeled with the PKH67 dye (green) followed by parallel ear injections into NOD/SCID mice. (C) Representative live images of a mouse pair injected with the combinations of cells 10 and 20 d after injection. (D) Quantification of red fluorescence signal (intensity × surface area) corresponding to SCC13 cell expansion. n = 4 lesions per condition, mean ± SEM, two-tailed paired t test, *, P < 0.05. (E) H&E staining of ear lesions formed by SCC13 cells injected with dermal fibroblasts with and without Atf3 deletion. (F) Quantification of phospho-histone 3 (pH3)–positive DsRed2-SCC13 cells in mouse ear lesions. n = 4 fields per lesion, at least 200 cells per field; mean ± SEM, two-tailed unpaired t test, *, P < 0.05; **, P < 0.005. (G) IF analysis of mouse ear lesions with Ab against MMP1 using DsRed2 fluorescent signal for SCC cell identification. (H) Representative images of IF analysis of ear lesions with Ab against CD31 (left panels), together with quantification of the total blood vessel area per field (μm2) of three pairs of ear lesions using ImageJ software (right panel). n = 4 (for mouse 1) and n = 5 (for mice 2 and 3) fields per lesion, mean ± SEM, two-tailed unpaired t test, *, P < 0.05. Additional representative images for E–G are shown in Fig. S1 (I–K).

