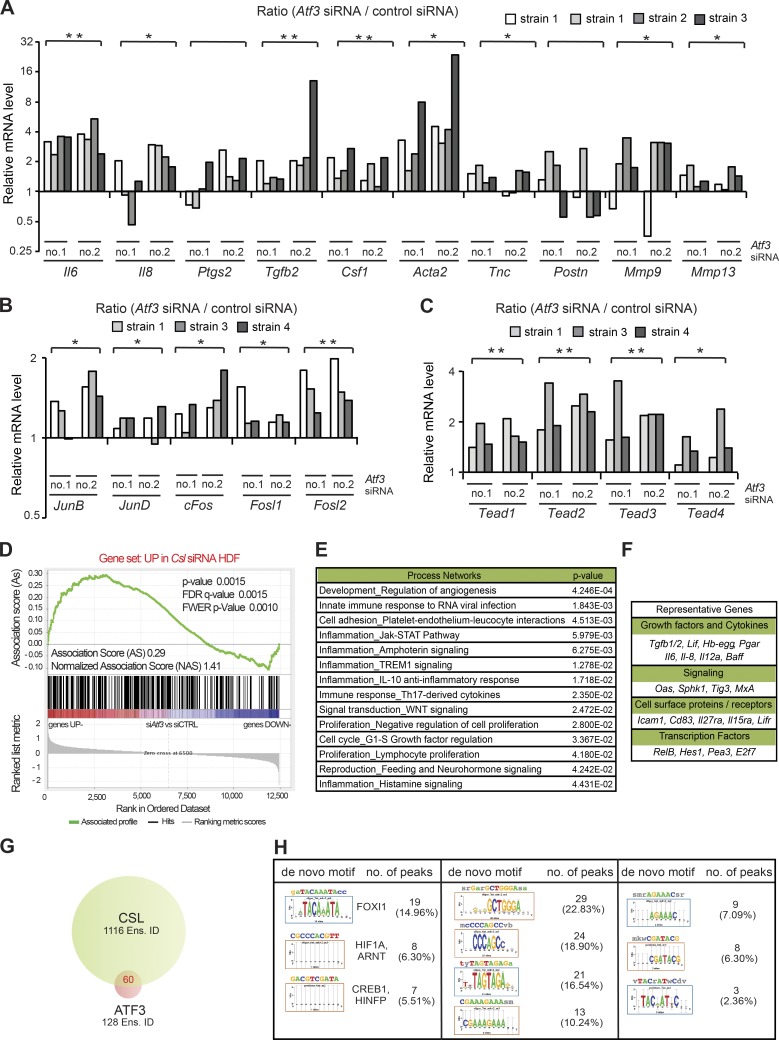
Figure 4.
Overlapping transcription repressive function of low levels of ATF3 and CSL. (A) RT-qPCR analysis of CAF effector genes in several independent strains of HDFs (strain 1 tested twice at different passages) with and without Atf3 silencing by two different siRNAs (no. 1 and no. 2), using 36β4 for normalization. n (HDF strains) = 8 siAtf3 no.1 and 2; 4 control siRNA. Values in A–C are expressed as log2 ratios (Atf3 siRNA/control siRNA), one-tailed, one-sample t test, *, P < 0.05; **, P < 0.005. (B) RT-qPCR analysis of AP1 family genes in independent HDF strains. n = 6 (siAtf3 no. 1 and 2), n = 3 (control siRNA). (C) RT-qPCR analysis of TEAD family members in independent HDF strains (strain 1 tested twice at different passages). n (HDF strains) = 6 siAtf3 no.1 and 2; 3 control siRNA. (D) Plot for gene set enrichment analysis (GSEA) using RNA-seq expression profiles of two HDF strains with and without silencing of Atf3 by two different siRNA against genes up-modulated in HDF by Csl silencing (Procopio et al., 2015). Genes are ranked by signal-to-noise ratio based on their differential expression in control versus ATF3-silenced HDFs; position of genes in the CSL gene set is indicated by black vertical bars, and the enrichment score is shown in green. (E) List of significantly affected process networks (P < 0.05) as identified by GeneGo MetaCore analysis of genes within the core enrichment resulting from GSE analysis in D. The complete list is provided in Table S5. (F) List of representative genes within the core enrichment of GSE analysis in D divided by biological function. (G) Venn diagram illustrating the number of Ensembl gene/transcript identifiers (Ens. ID) bound by endogenous ATF3 and CSL in HDFs, as identified by ChIP-seq analysis with anti-ATF3 Ab of HDFs under basal conditions in comparison with the previously obtained ChIP-seq binding profile of endogenous CSL (Procopio et al., 2015). A complete list of binding peaks and corresponding genes is provided in Table S6. (H) Motif enrichment analysis of nucleotide sequences surrounding endogenous ATF3 binding peaks using the RSAT peak-motifs tool. The number of ATF3 binding peaks with at least one predicted site of the indicated transcription factors is indicated, along with the corresponding percentage.

