Figure 5.
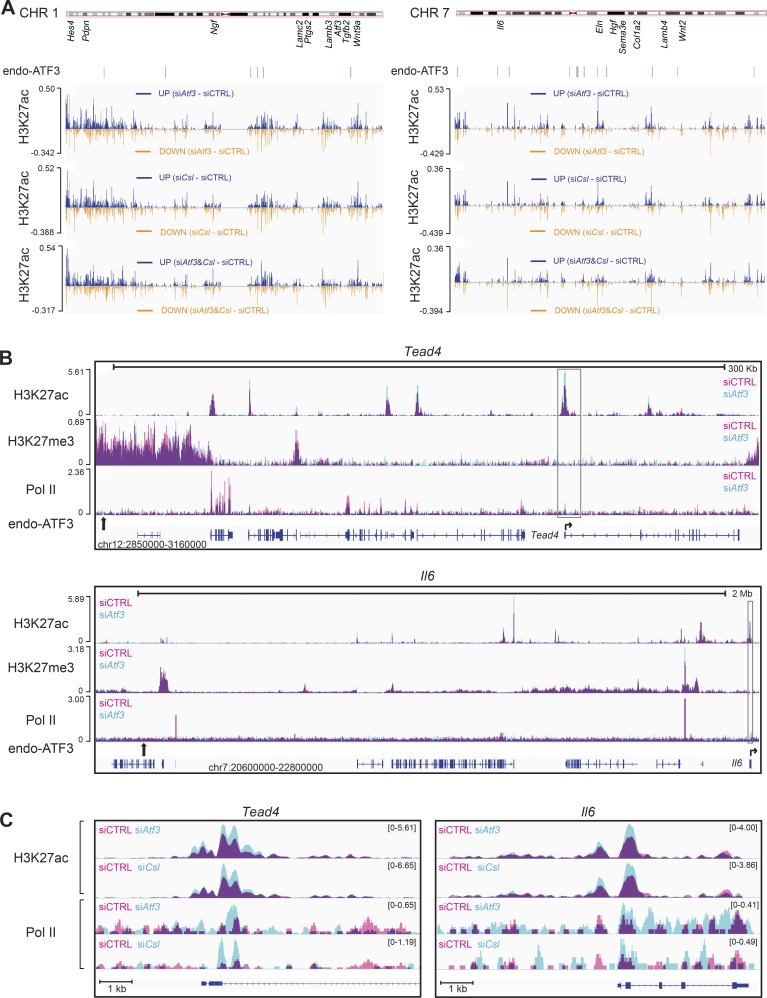
Atf3 and Csl gene silencing cause similar overlapping changes in global chromatin configuration. ChIP-seq analysis of histone marks (H3K27ac and H3K27me3) and RNA Pol II in HDFs upon siRNA-mediated silencing of Atf3 and Csl compared with the scrambled siRNA control. (A) Difference in H3K27 acetylation along the length of two representative chromosomes (CHR 1 and 7) in HDFs with silencing of Atf3 (siAtf3) and Csl (siCsl), individually and in combination (siAtf3 and Csl) relative to control cells (siCtrl). The approximated location of individual CAF-related genes and endogenous ATF3 binding position as assessed by ChIP-seq are shown below the chromosomal maps. Individual patterns of H3K27ac along the length of the two chromosomes in A are shown in Fig. S2 C. Differences in H3K27ac for the other two chromosomes (CHR 2 and 4) are shown in Fig. S2 D. (B) Changes in H3K27 acetylation and trimethylation together with Pol-II recruitment caused by Atf3 silencing at genomic loci encompassing endogenous ATF3 binding sites and flanking Tead4 and Il6 genes. Peaks of histone modification or Pol-II present in control HDFs (siCTRL) are shown in pink, peaks in HDFs with Atf3 gene silencing (siAtf3) are shown in turquoise, and overlapping areas present in both cells are shown in purple. For each panel, the chromosomal locations of the shown loci and scale bars are depicted at the bottom and top, respectively. Positions of ATF3 binding sites (calculated by MACS; Table S6) are indicated by vertical black arrows, and their zoom-in binding peaks are shown in Fig. S3 B. Lower lines are transcribed and spliced regions (blue boxes = coding exons) as predicted by Ensembl, together with the position and direction of transcription start sites (horizontal arrows). (C) “Zoomed in” chromatin modifications of the Tead4 and Il6 loci corresponding to the boxed region in B. Individual profiles for each condition were visualized in IGV and merged using Adobe Photoshop.

