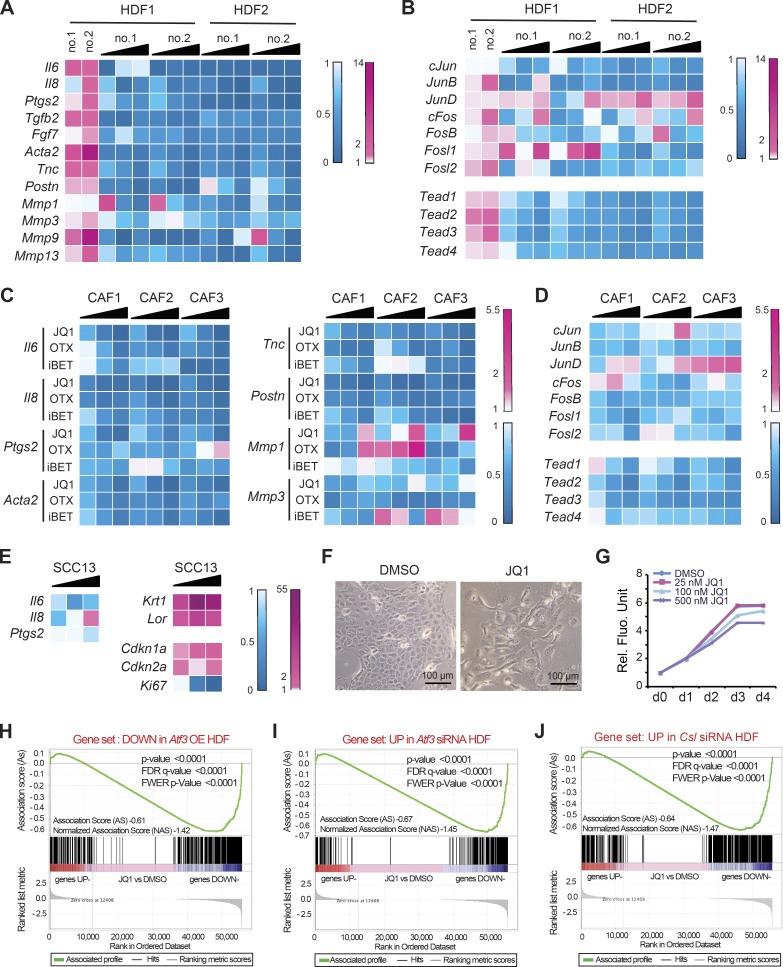
Figure 7.
BET inhibitors function as global suppressors of CAF gene transcription, with overlapping impact with ATF3- and CSL-dependent gene transcription. (A and B) Two independent HDF strains with Atf3 gene silencing by two siRNAs (no. 1 and 2) were treated 24 h after transfection with increasing doses of JQ1 (25, 100, and 500 nM) or DMSO vehicle for an additional 48 h. As a reference, a parallel set of cells was transfected with anti-Atf3 siRNAs versus scrambled siRNA control. Expression of the indicated CAF effector (A) and positive regulator (B) genes was assessed by RT-qPCR. Results are shown as a heat map of ratios of gene expression (folds of down- or up-regulation in blue and magenta, respectively) in drug-treated versus DMSO control HDF and in cells with and without Atf3 silencing. (C) Three independent CAF strains from surgically excised skin SCCs were treated with increasing amounts (25, 100, and 500 nM) of three different inhibitors—JQ1, OTX-015 (OTX), and iBET 762 (iBET)—in parallel with DMSO alone for 48 h followed by RT-qPCR analysis of the indicated genes shown as a heat map plot. (D) CAF strains were treated with JQ1 (25, 100, and 500 nM) or DMSO control for 48 h, followed by RT-qPCR analysis of the indicated CAF-positive regulator genes shown as a heat map plot. (E) SCC13 cells were treated with JQ1 at increasing amounts (25, 100, and 500 nM) versus DMSO vehicle alone for 48 h, followed by RT-qPCR analysis of the indicated genes and heat map plotting of the results. (F) Morphological changes induced in SCC13 cells by JQ1 treatment (500 nM) versus DMSO vehicle for 48 h. (G) Alamar blue cell density assays of SCC13 cells in triplicate wells treated with JQ1 at the indicated doses or DMSO alone, with daily measurements for 4 d. (H–J) Plot of gene set enrichment analysis (GSEA) using RNA-seq expression profile of three CAF strains with and without JQ1 treatment (500 nM for 2 d) versus vehicle (DMSO) against (H) set of genes down-modulated by induced ATF3, (I) set of genes up-regulated by siRNA-mediated Atf3 silencing, and (J) set of genes up-regulated by siRNA-mediated Csl silencing. Genes are ranked by the signal-to-noise ratio based on their differential expression in CAFs with JQ1 versus vehicle treatment; positions of the genes from the gene set are indicated by vertical bars, and the enrichment score is shown in green. The complete list of significantly enriched process networks (P < 0.05) identified by GeneGo MetaCore analysis for genes within the core enrichment resulting from GSEA analysis is provided in Table S8.

