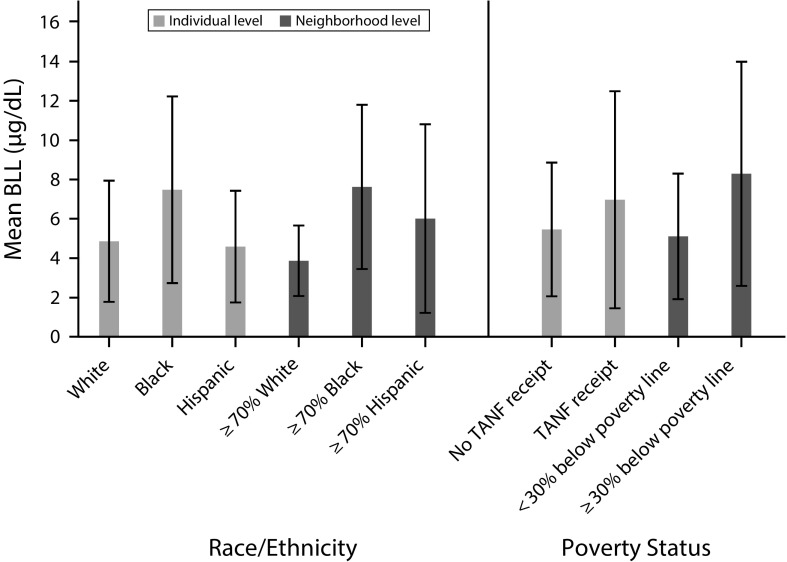
FIGURE 1—
Childhood Lead Exposure by Individual- and Neighborhood-Level Race/Ethnicity and Poverty Status: Birth Cohort of the Project on Human Development in Chicago Neighborhoods, Chicago, IL, 1995–2013
Note. TANF = Temporary Assistance for Needy Families. The figure shows the average blood lead level in µg/dL when children were younger than 6 years. Means are weighted. Whiskers indicate SDs.

