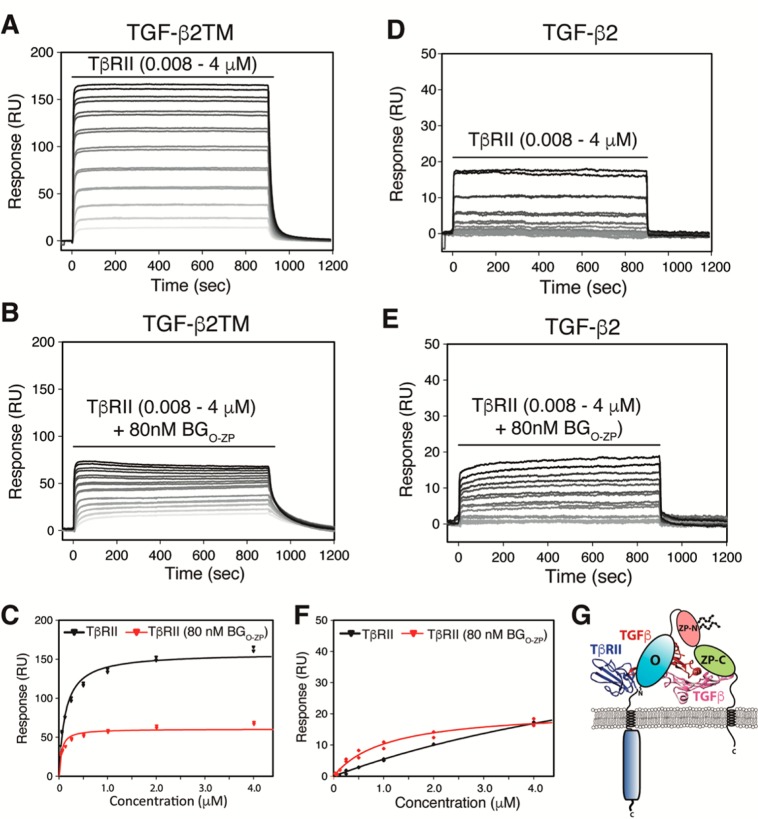
Figure 3.
Effect of betaglycan binding on TβRII binding to TGF-β2 and TGF-β2TM. (A and B) SPR sensorgrams for binding of TβRII to TGF-β2TM in the absence and presence of 80 nM BGO-ZP, respectively. Black lines over sensorgrams denote the period of injection of a 2-fold dilution series of TβRII from 4 to 0.008 μM. (C) Plot of the equilibrium response for binding of TβRII to TGF-β2TM in the absence (black) or presence (red) of 80 nM BGO-ZP. Equilibrium binding constants were obtained by fitting the equilibrium response as a function of concentration to a standard binding isotherm. The fitted curve is shown as a solid black or red line in the absence or presence of BGO-ZP, respectively. (D and E) SPR sensorgrams for binding of TβRII to TGF-β2 in the absence and presence of 80 nM BGO-ZP, respectively. Other details are as described for panels A and B. (F) Plot of the equilibrium response for binding of TβRII to TGF-β2 in the absence (black) or presence of 80 nM BGO-ZP (red). Other details are as described for panel C. (G) Schematic depiction of the 1:1:1 TGF-β/TβRII/BGO-ZP ternary complex suggested by the SPR binding data shown in Figures 2 and 3.

