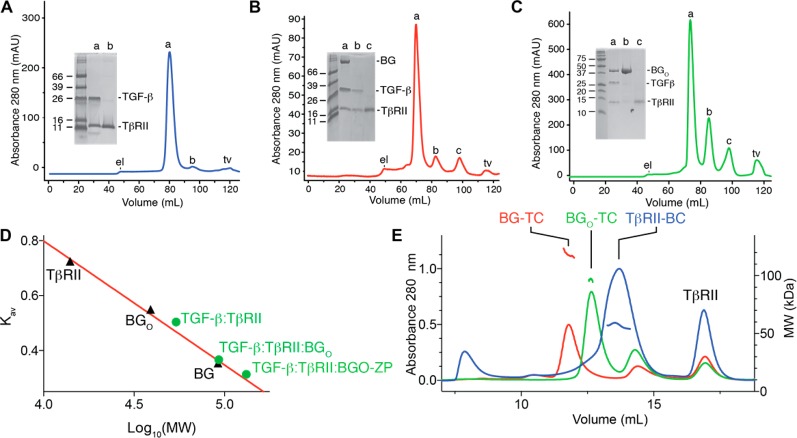
Figure 4.
Complexes formed between BGO-ZP and BGO with TGF-β and TβRII in solution as assessed using SEC and SEC–MALS. (A–C) Superdex 200 16/60 SEC chromatograms for complexes formed by adding 2.5 equiv of TβRII to 1.0 equiv of TGF-β2TM, 0.75 equiv of BGO-ZP to 1.0 equiv of 2.5:1 TGF-β2TM/TβRII binary complex, and 3.0 equiv of BGO to 1.0 equiv of 2.5:1 TGF-β2TM/TβRII binary complex, respectively. Peaks labeled “el” and “tv” on the chromatograms correspond to the exclusion limit and total volume for the column, respectively. Shown in the inset is a nonreducing SDS–PAGE gel of the major peaks that eluted. (D) Plot of the SEC partition coefficient, Kav, as a function of the logarithm of the molecular weight for three proteins studied alone, TβRII, BGO, and BGO-ZP (black triangles). The red line corresponds to a fit of the data for the proteins alone (TβRII, BGO, and BGO-ZP), which are of known size, to a straight line. Green circles shown on the plot correspond to the Kav values for the TGF-β2TM/TβRII, TGF-β2TM/TβRII/BGO, and TGF-β2TM/TβRII/BGO-ZP complexes plotted as a function of the molecular weights of the complexes assuming the stoichiometries inferred from the SPR measurements (1:2 TGF-β2TM:TβRII, 1:2:1 TGF-β2TM:TβRII:BGO, and 1:1:1 TGF-β2TM:TβRII:BGO-ZP). (E) Superdex 200 Increase 10/300 GL SEC–MALS chromatograms obtained for the same three complexes shown in panels A–C. Complexes are labeled as follows: BG-TC (TGF-β2TM/TβRII/BGO-ZP), BGO-TC (TGF-β2TM/TβRII/BGO), and TβRII-BC (TGF-β2TM/TβRII). Estimated molecular weights derived from the multiangle light scattering measurements are shown below the peak for the TGF-β2TM/TβRII binary complex (blue traces) and above the peaks for the TGF-β2TM/TβRII/BGO and TGF-β2TM/TβRII/BGO-ZP ternary complexes (green and red traces, respectively). One unexpected observation is that the peak corresponding to the excess TGF-β2TM/TβRII binary complex present in the TGF-β2TM/TβRII/BGO-ZP sample eluted at a volume (panel E, red trace, 13.6 mL) slightly larger than that of the peak for the TGF-β2TM/TβRII binary complex sample (panel E, blue trace, 12.6 mL). Multiple runs performed with decreasing amounts of the TGF-β2TM/TβRII complex loaded show that this is due to a loading effect, with larger amounts loaded (and thus higher concentrations) eluting earlier (Figure S3). Most likely, the earlier elution at higher loading concentrations is the result of the preponderance of 1:2 TGF-β2TM/TβRII binary complexes, while at lower loading concentrations, there is a preponderance of 1:1 TGF-β2TM/TβRII binary complexes.

